The Log records what SoftwareCentral and its Windows service did: every Robopack check, every import
job, every change made in the portal. Use it to find out why something happened, and to see the result of a
job while it runs.
General logPersonal logEvent logBest practiceTroubleshooting
1 What the Log is for
Every action that SoftwareCentral takes is written to the Log with its time, the user or service account that
did it, the details, the Intune tenant and a category. The Robopack check, for example, writes one line for each
application it checks, and an END CHECKING ROBOPACK FOR NEW VERSIONS line when it is finished.
2 The page at a glance
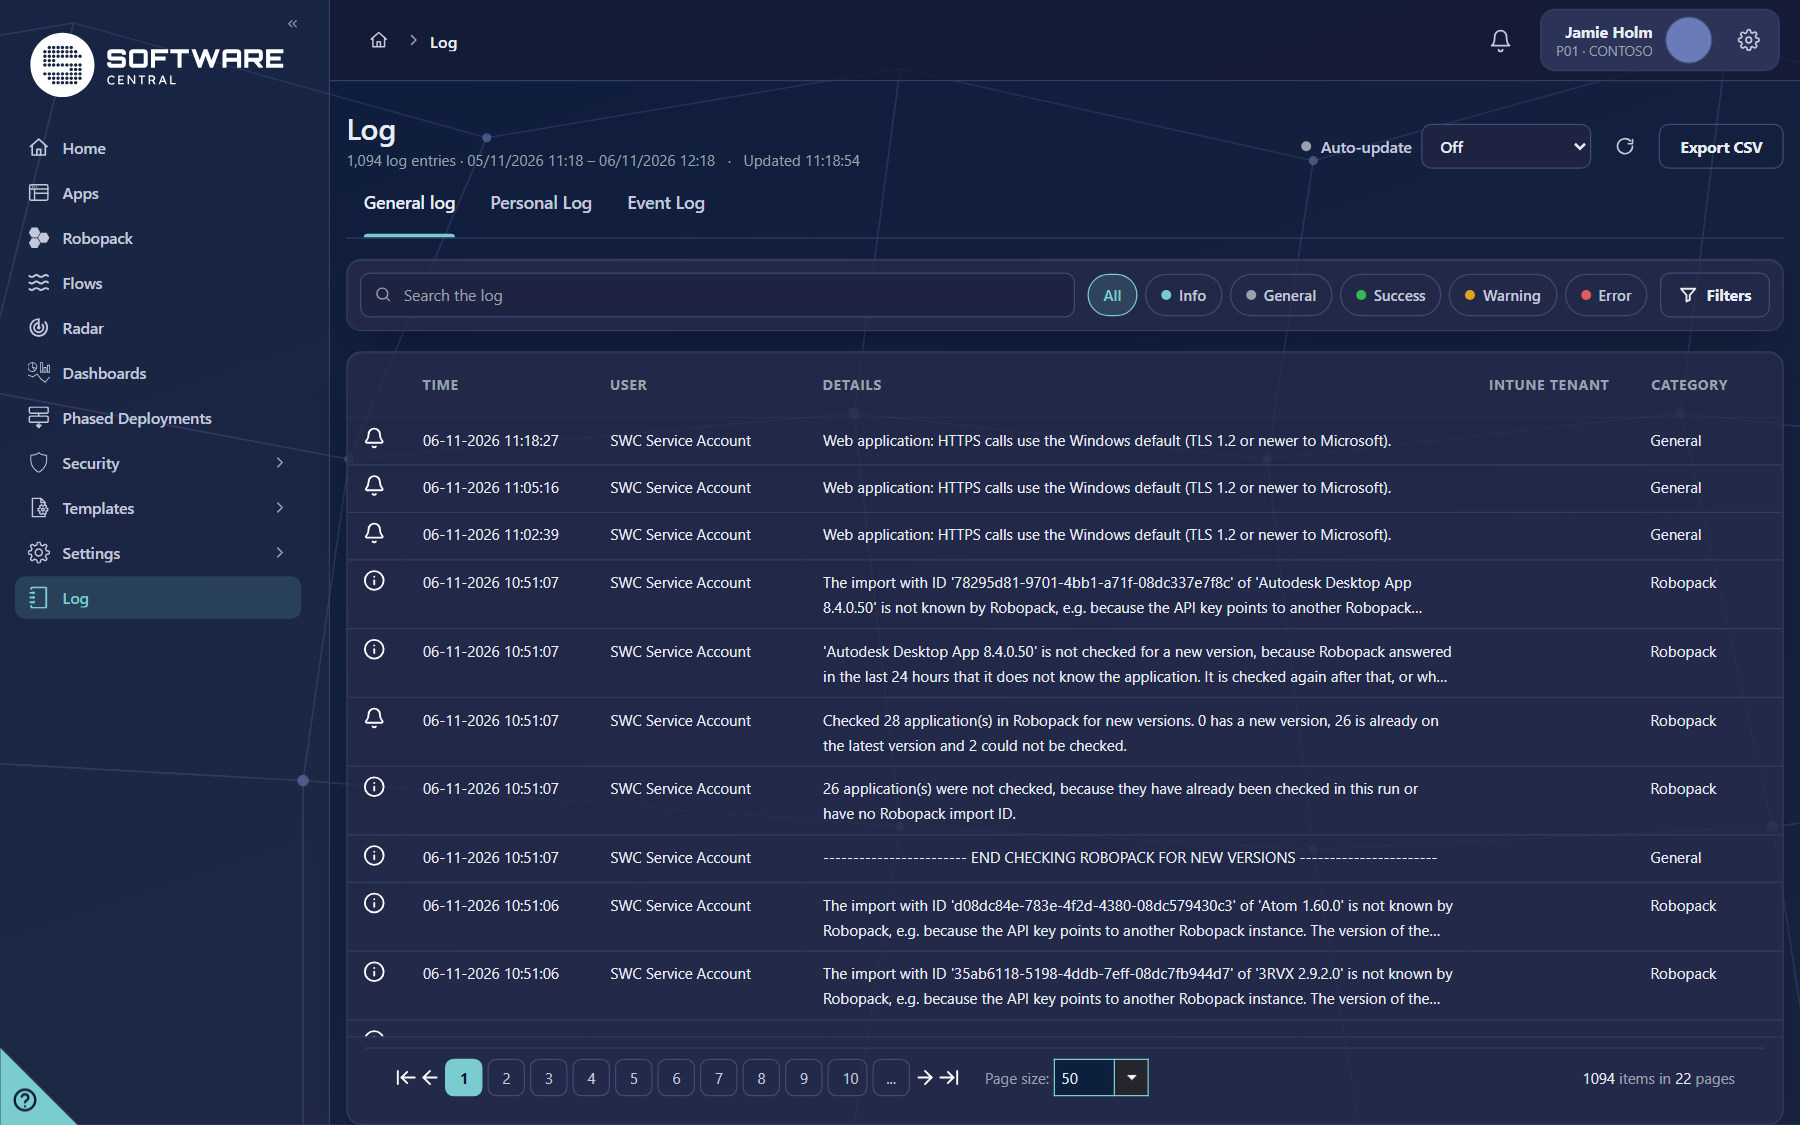
The header shows the number of entries in the range shown and the time of the last update. On the right are the
Auto-update choice, the Refresh button and Export CSV. The tabs, the search box, the level chips
and the Filters button are below. The entries are listed in a table with pages at the bottom.
The Log on the General log tab. The default range is the last day up to an hour from now.
3 Log tabs
Tab
What it shows
General log
All entries, from every user and from the service. Shows the User column and, with the right role, the Show debug log tick box.
Personal Log
The tasks you started yourself.
Event Log
The event logs from the SoftwareCentral server. It has no User, Importance, Category or Intune Tenant column, and it does not offer the level chips or the user and debug filters.
Which tab is shown
The General log tab is shown only to roles that have it. If your role does not have it, the page opens on the tab you are allowed to use.
4 Search, levels and Filters
Search the log finds entries that contain the text you type; press Enter or wait for the search to run.
The level chips choose which kinds of entry are shown. All is the default.
Chip
Shows
All
Every entry (default).
Info
Detail entries.
General
General messages.
Success
Successful steps.
Warning
Warnings.
Error
Critical and fatal errors.
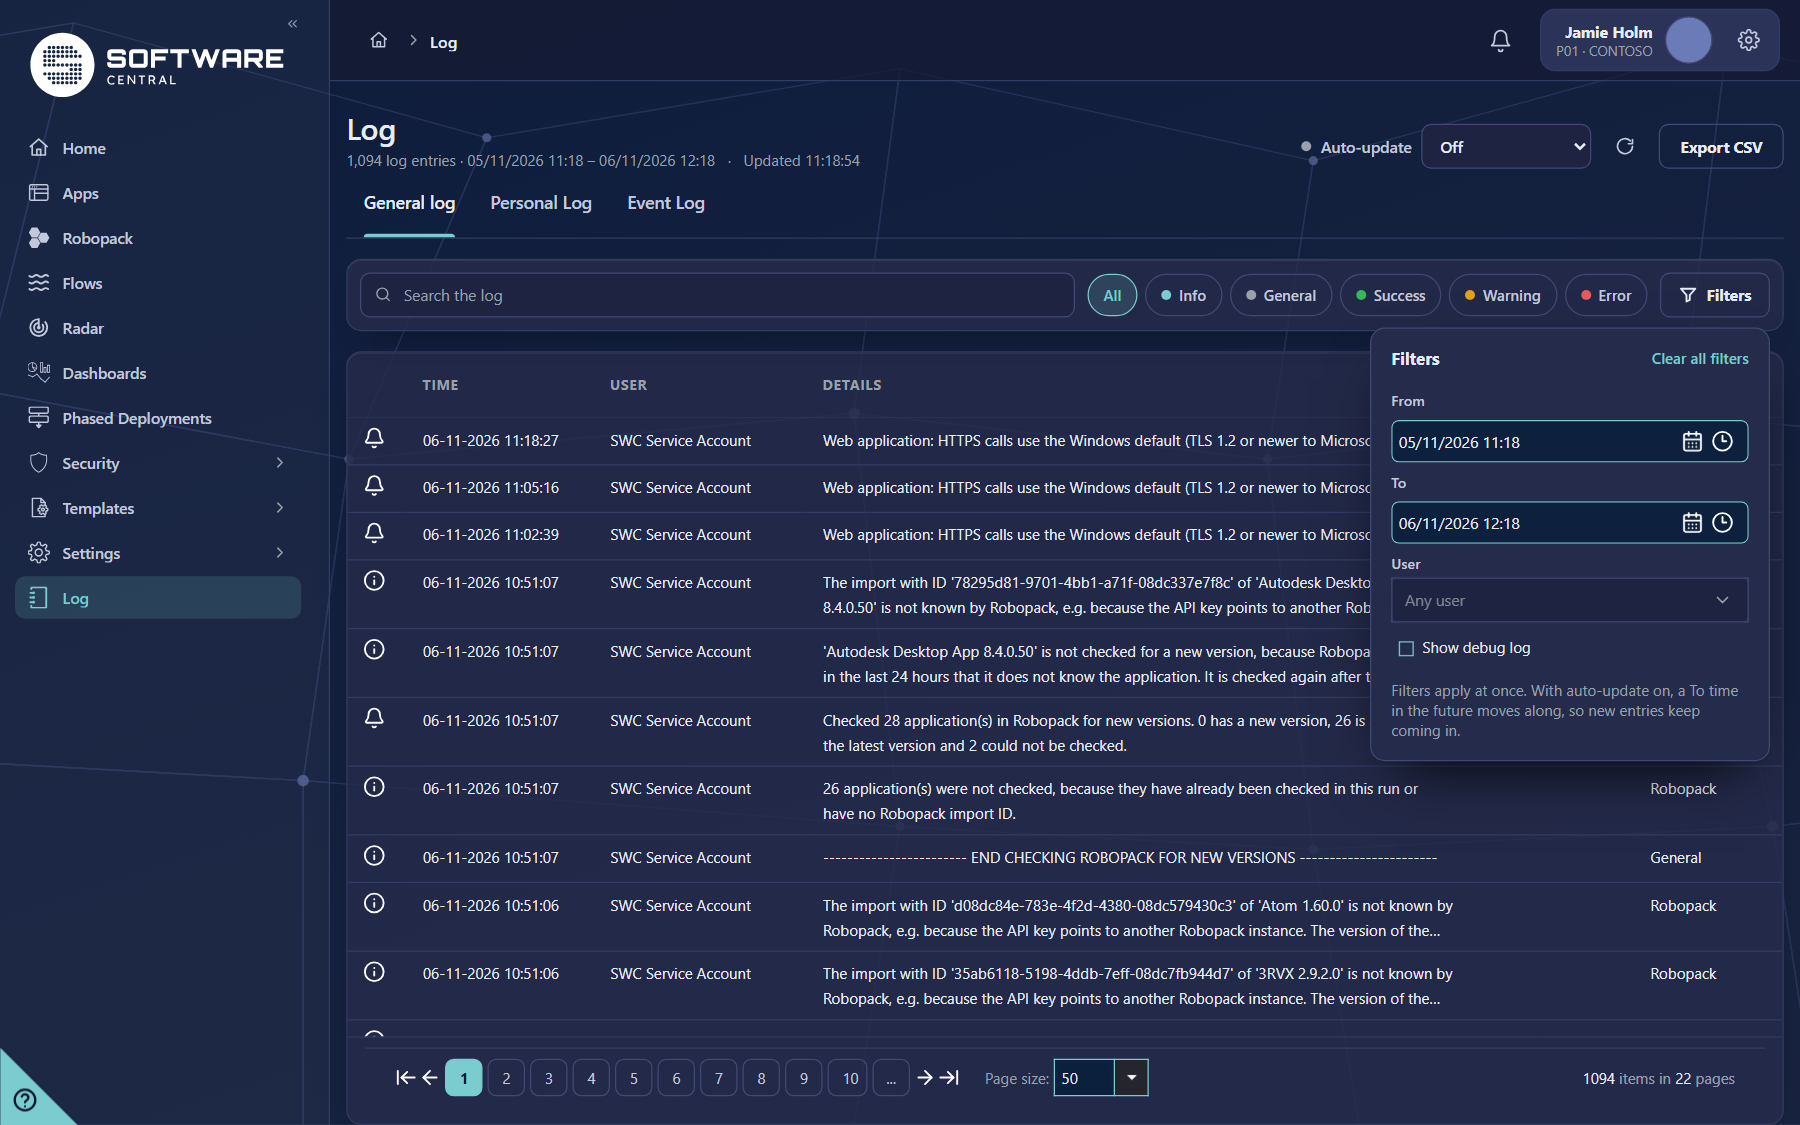
The Filters button opens a panel. Filters apply as soon as you change them.
The Filters panel. Clear all filters at the top resets it.
Filter
What it does
From and To
The time range, with a calendar and a time picker. Leave To in the future to keep new entries coming in while auto-update is on.
User
Only entries of one user. Any user is the default. It is not shown on the Personal Log tab.
Show debug log
Adds the debug entries. It is shown only to roles that can see the General log tab.
At most 10,000 entries per search
The log loads at most 10,000 entries for one search. For more, narrow the From and To range.
5 Columns and buttons
Item
What it does
Icon column
The importance of the entry (info, success, warning or error). Not shown on the Event Log.
Time
When the entry was written.
User
The user or service account that caused the entry, for example SWC Service Account for the service. Shown on the General log.
Details
The message of the entry.
Intune Tenant
The tenant the entry belongs to. Shown only when Intune is enabled, and not on the Event Log.
Category
Where the entry comes from, for example Robopack or General. Not shown on the Event Log.
Auto-update
Refreshes the list every 10 seconds, 30 seconds or minute. Off by default. The choice is kept in this browser only.
Refresh (icon)
Loads the list again now.
Export CSV
Downloads the log as a CSV file. The export contains user names, so share it only with people who need it.
6 Best practices
Topic
Recommendation
Start with errors
Choose the Error chip and the last day to see what failed. Then widen the range if needed.
Search for the application
Type the application name in Search the log, for example the name of a flow, to see its whole history.
Watch a run with auto-update
Turn on auto-update while a job is running, with the 30 second or one minute interval. Turn it off again afterwards.
Use the Personal Log for your own tasks
It shows what you started, which is quicker than filtering the General log by user.
Export only what you need
Narrow the range and the chips before you press Export CSV, and remove user names if the file is shared outside the team.
7 Troubleshooting
Symptom
Cause
What to do
No log entries match your criteria. Try to adjust your search with a longer timespan.
The date range, the search text, the chip or the user filter leaves no entries.
Widen From and To, choose All, and click Clear all filters.
Fewer entries than expected
A search loads at most 10,000 entries.
Narrow the time range and search again.
Auto-update does not refresh the list
It waits while you are reading: another page, a scrolled list, selected text, an open Filters panel, a hidden browser tab or a request that is still running.
Close the Filters panel, scroll to the top and wait. New entries are marked until the next refresh. Use Refresh to load them at once.
The auto-update choice is different on another computer
The choice is stored in each browser, not on the server.