1 How the dashboards work
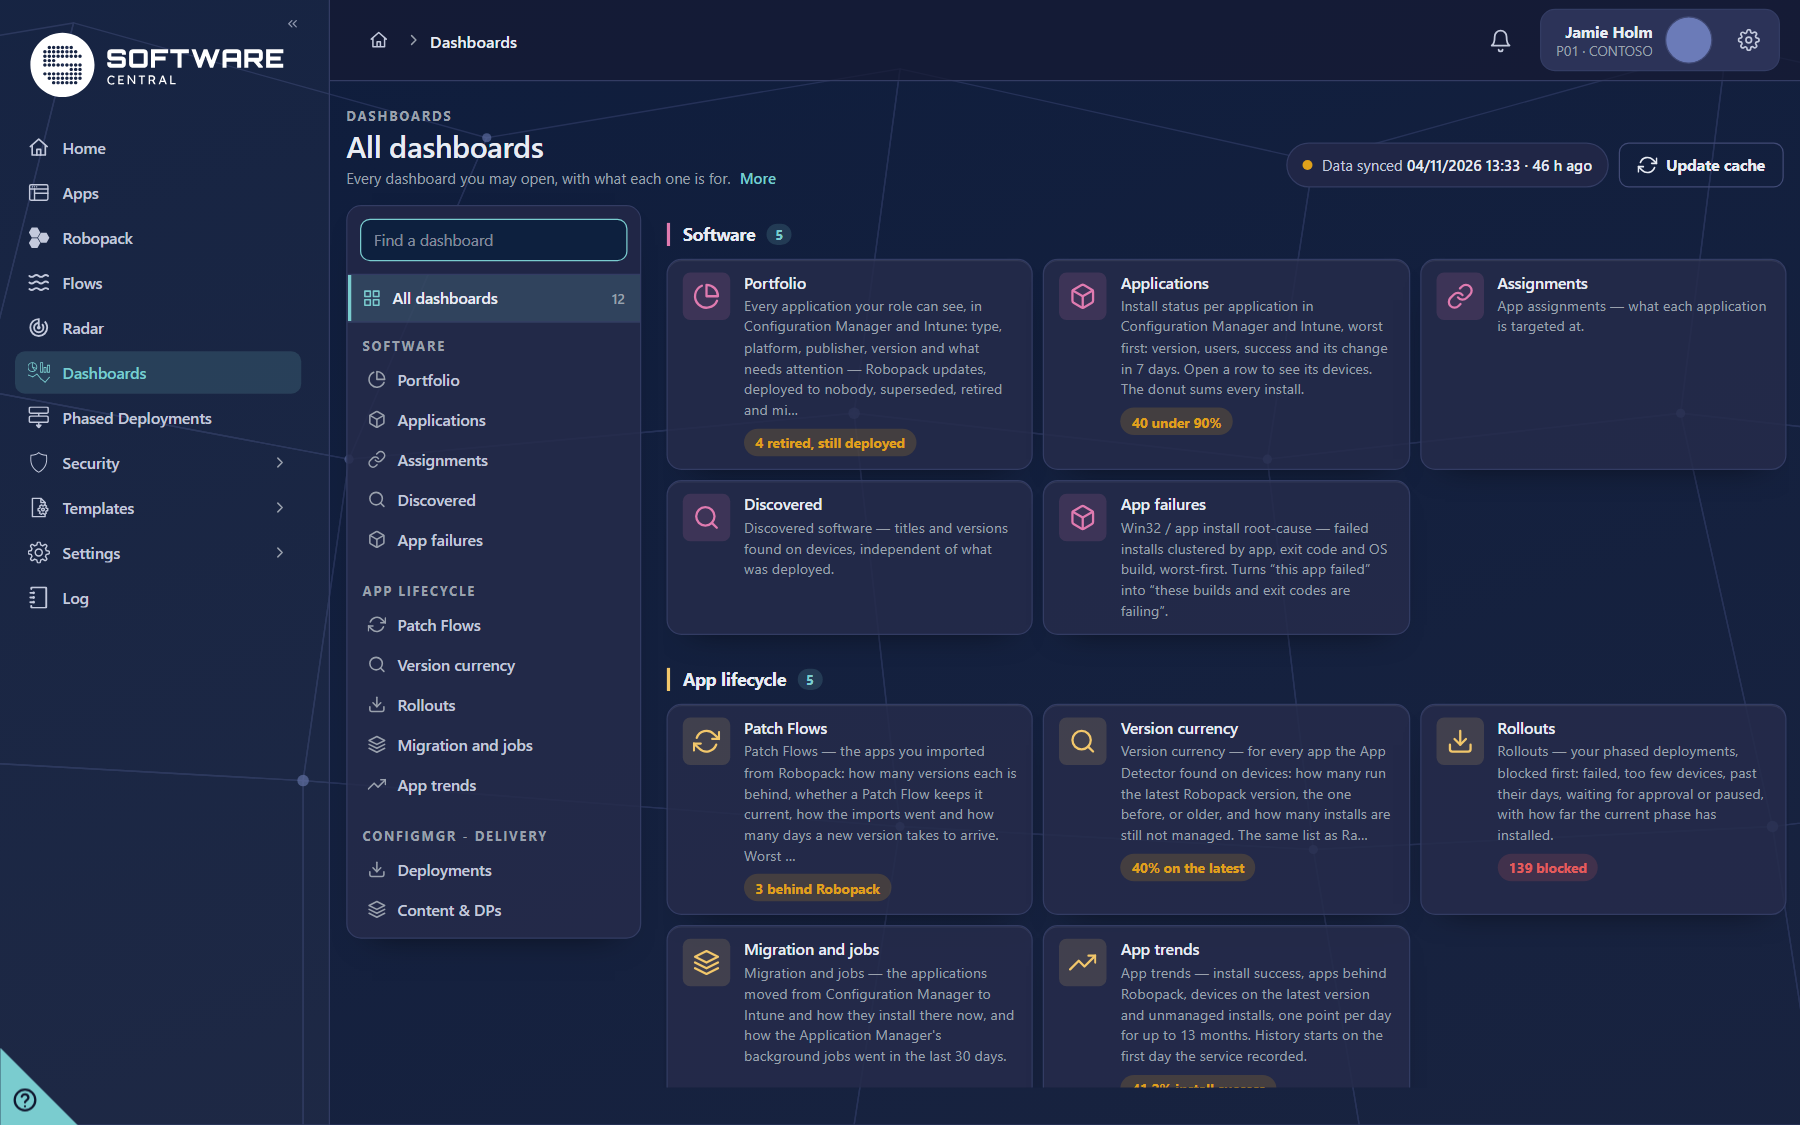
Open Dashboards in the top menu, after Radar. The page opens on All dashboards: a card for each dashboard you may open, with what it is for.
The left list
The list on the left holds every dashboard, grouped in three categories:
- Software – Portfolio, Applications, Assignments, Discovered and App failures.
- App lifecycle – Patch Flows, Version currency, Rollouts, Migration and jobs and App trends.
- ConfigMgr – Delivery – Deployments and Content & DPs. These two read the Configuration Manager site.
Above the categories, All dashboards shows how many dashboards there are (12). The Find a dashboard box filters the list by name. Click a name to open that dashboard; the highlighted name shows where you are.
The header
- Breadcrumb – the category and dashboard you are in, for example Dashboards › Software › Portfolio.
- Description – one line on what the dashboard answers. More opens a longer explanation.
- Data synced – the time the stored figures were last refreshed, and how long ago that was. On the ConfigMgr dashboards the header also says when the Configuration Manager summaries were last recalculated.
- Update cache – starts a refresh of the stored data behind the dashboards (the deployment and content summaries, the Intune application data and the application failures). The figures change when the refresh has finished. The dashboards only read; this button does not change anything in Intune or Configuration Manager.
The parts of a dashboard
| Part | What it does |
|---|---|
| Source switch | On the Software dashboards: All, Configuration Manager or Intune. Choose one to see only that platform. The bar also names the site and the Intune tenant the figures come from. |
| Tiles | The row of figures at the top. Click a tile to filter the list underneath to the rows that make up that figure. |
| Charts | Bars, donuts and lines. Many charts filter the list when you click a bar, a segment or a name. Charts that show a trend are drawn one point per day. |
| List | The rows behind the figures. The worst items are at the top. Use the search box to find a row, click a column heading to sort, and use the page numbers at the bottom. Show data opens the list when it is folded away. |
| Chevron (the up arrow on a card) | Hides the charts above a list so the list has the whole tab. |
| [i] | Explains the card you are looking at: what it counts, what the numbers mean and where they come from. Read it first when a figure surprises you. |
| Download icon / Export | Saves the rows the list shows now, with the same filter, source and search, as CSV, Excel or JSON. The file holds the application ID (and the device ID where there is one), so it can be used in a report or a ticket. |
How to read the figures
- Counts are exact. A small count shows the number, not a range.
- A dash (–) means unknown, not zero. For example, Intune reports no figure for an application that is not assigned yet.
- Percentages are of the finished installs on the install dashboards: installed of the installs that finished (installed plus failed). Installs that are not applicable or still in progress are left out of that percentage.
- Not applicable (Configuration Manager: requirements not met) is shown as its own group. It is never counted as a failure.
- Configuration Manager counts per deployment. A device that is in two deployments of the same application is counted twice.
- Disclosed caps. Where a list is capped, the page says so. The Discovered device list shows the first 1,000 devices; the per-device lists under an application show the first 500 devices; ConfigMgr failures are read from the newest 5,000 failed installs; an export holds up to 100,000 rows (20,000 for Excel).
Your role decides what you see
Each dashboard only shows the applications and collections that your portal role may see. Totals, tiles and charts are worked out from those applications only, so two administrators with different roles can see different figures for the same tenant. Intune device lists follow the same rule. If a figure is missing, check your role first (see Security roles).
How often the figures change
The dashboards do not query everything live on every click. The background service of SoftwareCentral collects the data on a schedule and stores it. Most figures are therefore some minutes old; some are older.
| Kind of figure | When it is refreshed |
|---|---|
| Intune application data (Portfolio, Assignments, Discovered, App failures) | By the background service, every 30 minutes by default. The Data synced time shows when it last ran. |
| Intune install figures (Applications, Migration and jobs) | Read from Intune when you open the dashboard and kept for 2 minutes. |
| ConfigMgr deployments (Deployments) | The Configuration Manager summaries are recalculated by the service every 15 minutes. |
| ConfigMgr content (Content & DPs) | The distribution point lists read the site; the trend lines are recorded by the service once an hour. |
| ConfigMgr applications and failures (Applications, Assignments, App failures) | Read from the site when you open the dashboard. The failure and deployment reads are kept for 2 minutes. |
| ConfigMgr inventory (Discovered) | Read when you open the tab and kept for 30 minutes. Update cache reads it again. |
| Robopack, Patch Flows, Rollouts, Migration jobs | Read from the SoftwareCentral database when you open the dashboard. Robopack is checked for new versions every 30 minutes by the service (see Automated patch flows). |
| Version currency and Discovered “Managed” | From the App Detector, which scans the devices every 6 hours (see Radar). |
| Rollout progress (Installed in Rollouts) | Measured by the service’s compliance check, which runs every few hours. “-” means the phase has not been measured yet. |
| App trends (and the 7-day movement on other dashboards) | One record per day for each application and site or tenant, written once a day by the service. |
2 Where the data comes from
Three kinds of source feed the dashboards. Each dashboard section below names its own sources; this is the overview.
| Source | What is read | Used by |
|---|---|---|
| Microsoft Graph / Intune (read on the server) | Applications, their assignments and filters, group names, the install summary of each application, detected apps and per-device install status. | Portfolio, Applications, Assignments, Discovered, App failures, Migration and jobs, App trends |
| Configuration Manager site database (read-only views of the site) | Applications and deployments, their collections and states, deployment summaries and error codes, distribution points and content, Add/Remove Programs and the devices in your role’s collections. | Portfolio, Applications, Assignments, Discovered, App failures, Deployments, Content & DPs |
| SoftwareCentral database | Robopack status and imports, Patch Flow rules, App Detector results, phased deployments and their phases, migrated applications, service jobs, and the daily App trends record. | Portfolio (Robopack and migration), Patch Flows, Version currency, Rollouts, Migration and jobs, App trends, Discovered (Robopack match) |
The dashboards need no permission beyond the ones the SoftwareCentral app registration already has for Application Manager Only. The Intune permissions are listed on Intune permissions. Without the directory read permission, the Assignments targets show as group IDs instead of group names. To check the permissions per dashboard, open the tenant under Settings › Configuration › Intune Configuration and press Test connection and permissions.
3 Portfolio
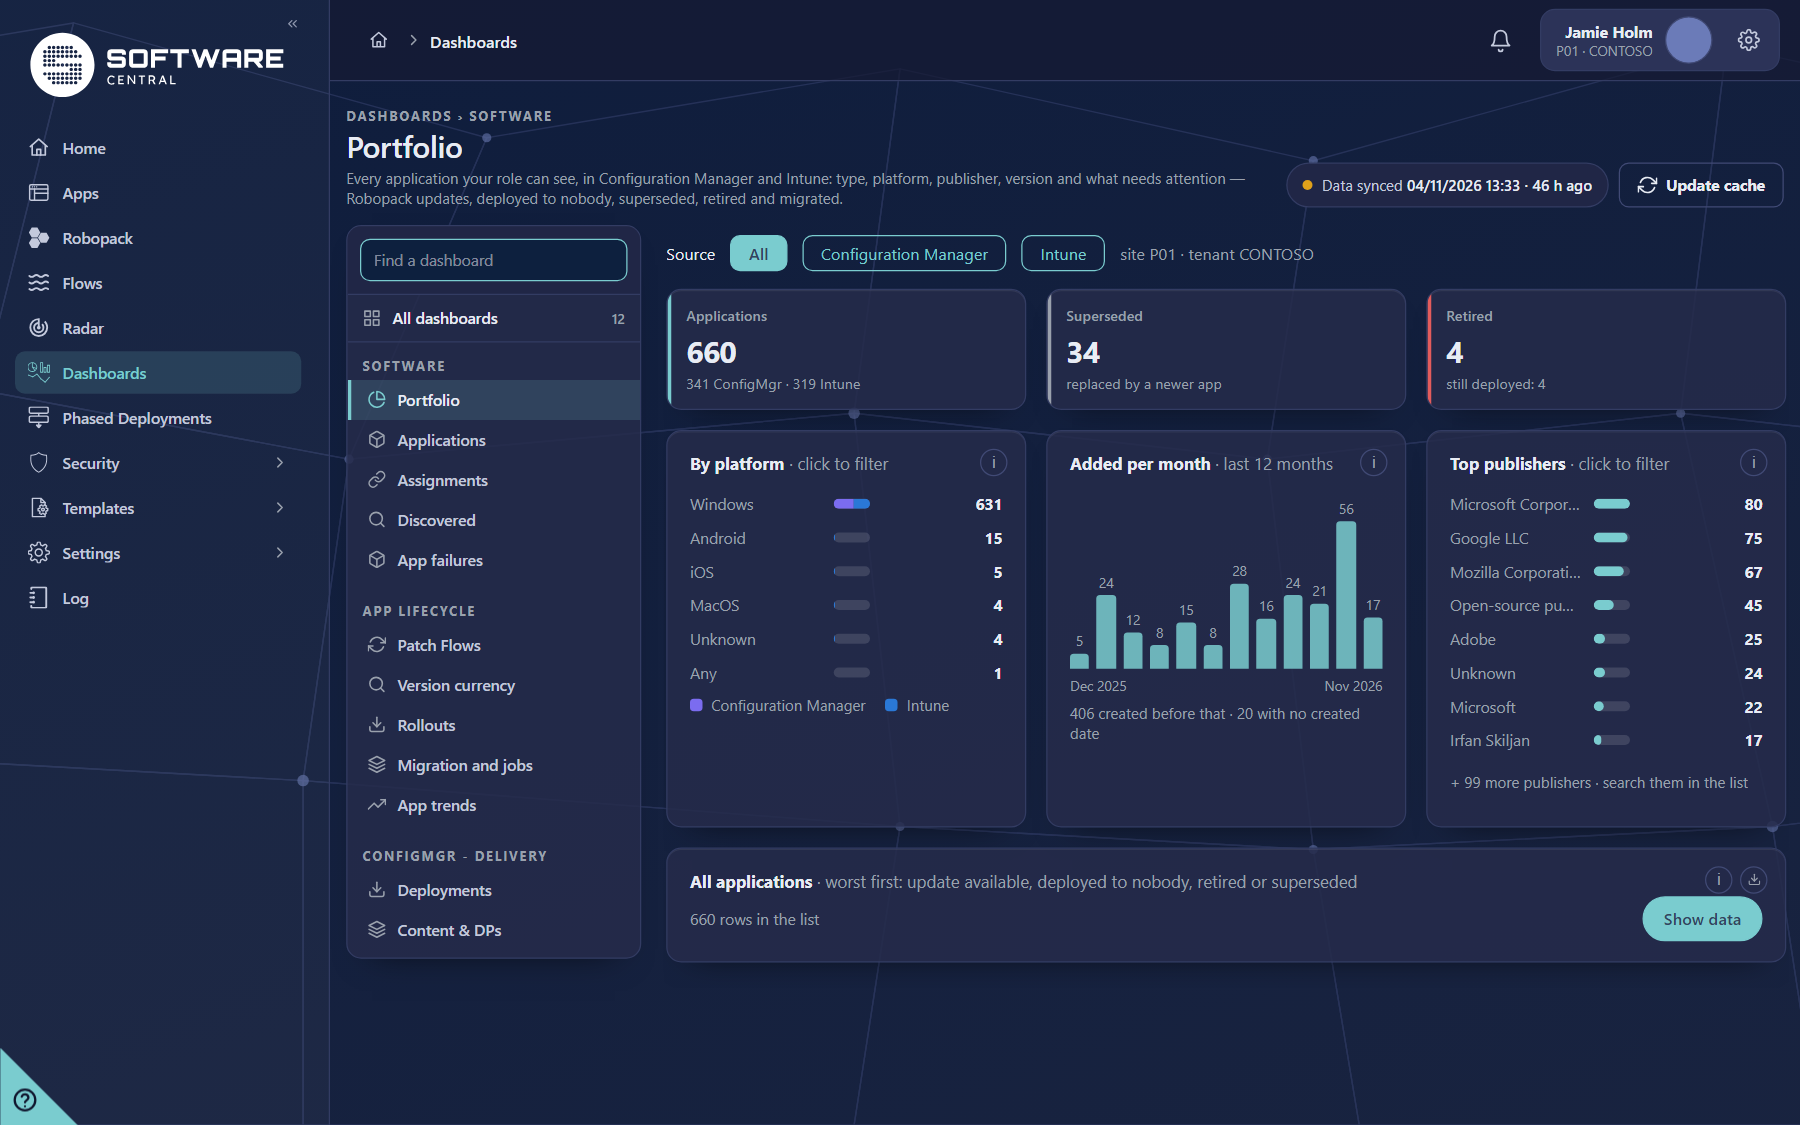
Software › Portfolio. Every application your role can see, in Configuration Manager and Intune, with what needs attention.
What it answers
What do we manage, what is still behind Robopack, what is deployed to nobody, what has been replaced or retired, and what has moved to Intune?
What you see
| Part | What it shows |
|---|---|
| Tiles | Applications (split into Configuration Manager and Intune), Superseded (replaced by a newer application), Retired (with how many are still deployed). |
| By platform | Applications per platform, stacked by source. Click a platform to filter the list. |
| Added per month | Applications added in each of the last 12 months. The card also says how many were created before that and how many have no created date. |
| Top publishers | The publishers with the most applications. Click one to filter the list; the rest are listed by search. |
| All applications | One row per application, worst first: update available, deployed to nobody, retired or superseded. Search, sort, export. |
Where the data comes from
- The list of applications: the same list the Application Manager shows for your role.
- Deployed and targets: the Assignments figures (see Assignments below).
- Update available: the newest Robopack version against the newest version imported (SoftwareCentral database).
- Configuration Manager dates and supersedence: the site, kept for 30 minutes.
- Intune dates and superseding apps: the Intune application data, refreshed by the service.
- Migrated: the migrated applications table (see Migration and jobs).
How to use it
- Start with Update available and Deployed to nobody: an application nobody receives will not be updated, and one behind Robopack needs a Patch Flow or a manual update.
- Click Superseded or Retired in the list to find applications that still have deployments.
4 Applications
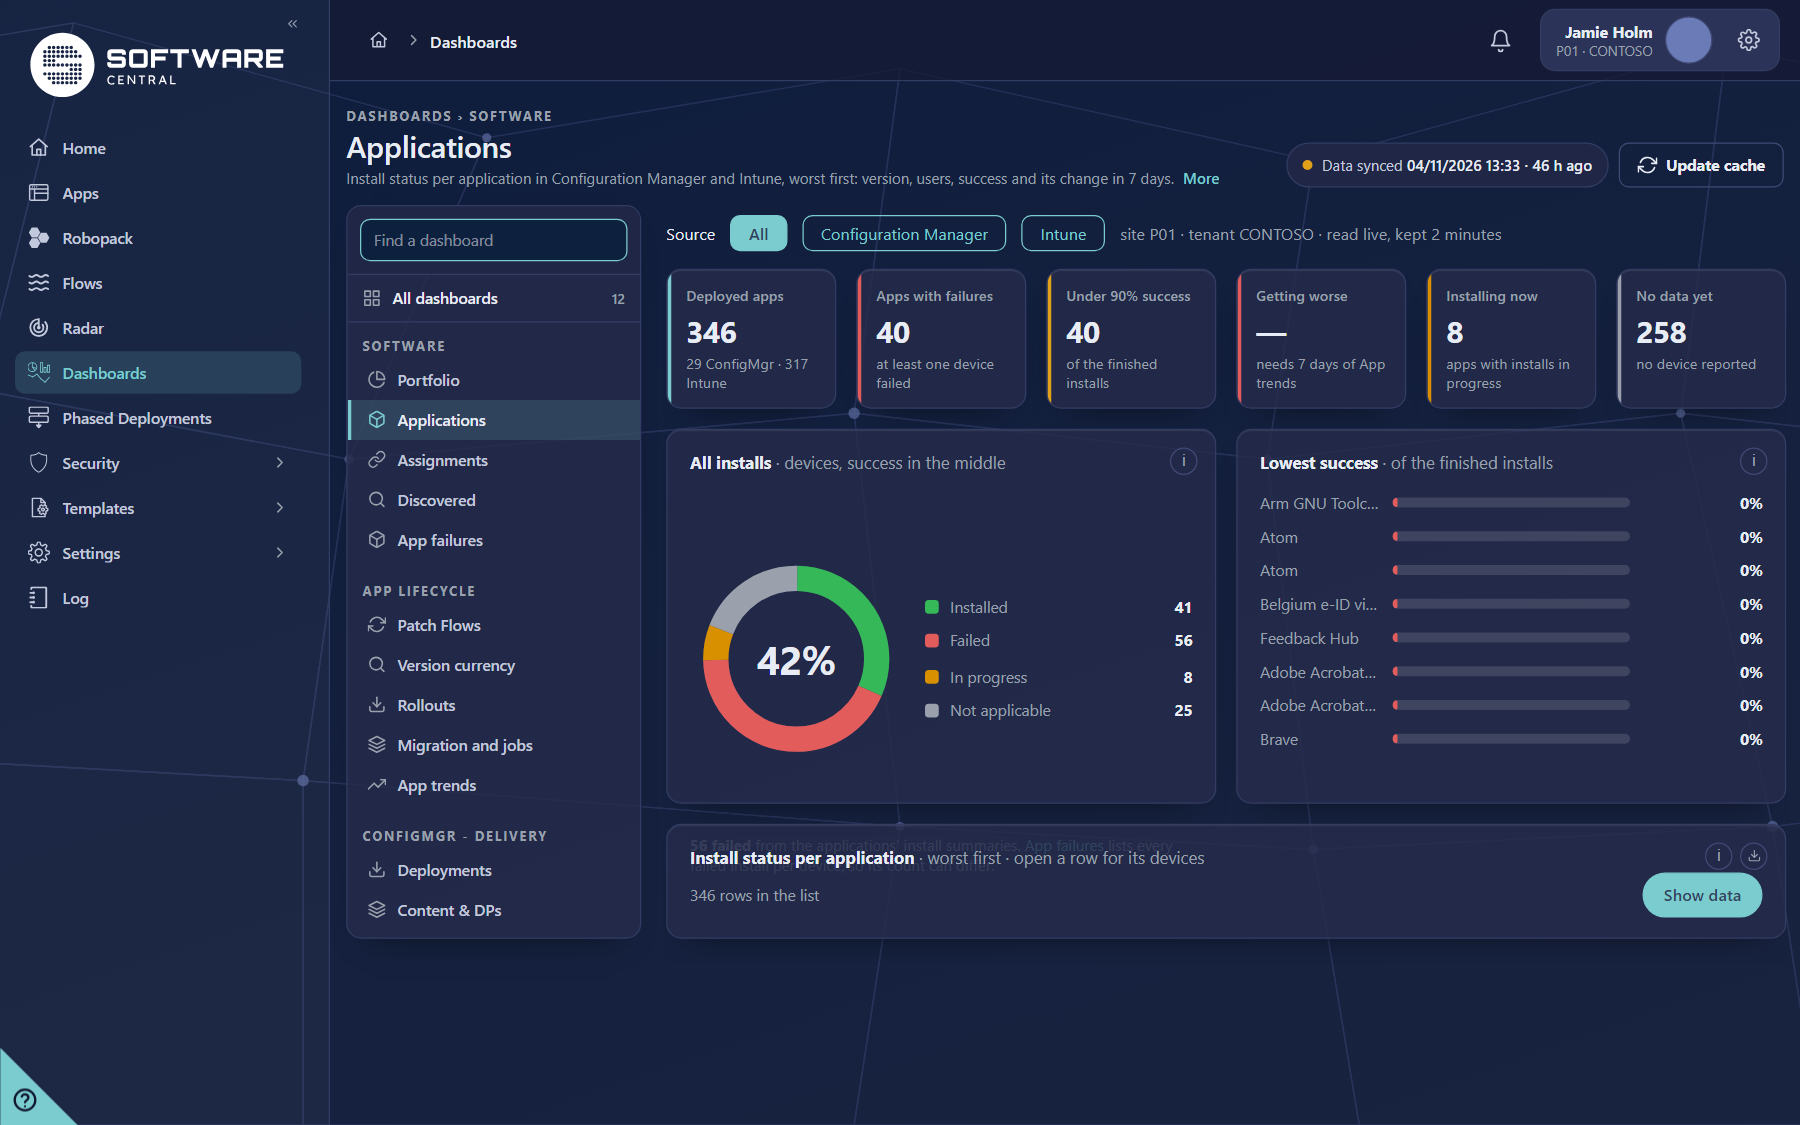
Software › Applications. Install status per application in Configuration Manager and Intune, worst first.
What it answers
Which applications are not installing successfully, on how many devices, and is it getting better or worse?
What you see
| Part | What it shows |
|---|---|
| Tiles | Deployed apps (with the split between the two platforms), Apps with failures (at least one device failed), Under 90% success (of the finished installs), Getting worse (the change in success against the App trends day a week ago; needs 7 days of App trends), Installing now and No data yet (no device has reported). |
| All installs | A donut of every install, split into installed, failed, in progress and not applicable. The centre shows the success rate. Click Failed or In progress to list those applications. |
| Lowest success | The worst eight applications by success of the finished installs. The bar shows how many devices are behind that share. Click a bar to list that application. |
| Change in 7 days | The applications whose success fell the most since the App trends day a week ago. It appears once there is that history. |
| Install status per application | One row per application and platform, most failures first. Columns: Application, Source, Version, Installed, Failed, In progress, Not applicable, Users (Intune only), Success, 7 days and ID. Open a row (the arrow) to see its devices. |
Where the data comes from
- Configuration Manager: the deployment summary of the site, read when you open the dashboard. Counts are per deployment.
- Intune: the install summary of the current tenant, read live and kept for 2 minutes.
- Opened row: Intune reads the devices of that application live (and gives the Troubleshoot link on failed devices). Configuration Manager lists the devices that reported a state in deployments your role may see, first 500.
- Change in 7 days: the App trends record (SoftwareCentral database).
How to use it
- Read the All installs donut first, then Lowest success, and open the worst application.
- Use the Source switch when one platform looks wrong: the two platforms count installs in different ways.
- A note under the donut says when the install summaries show a different number of failures from the App failures dashboard. That is expected: App failures lists each failed install per device.
5 Assignments
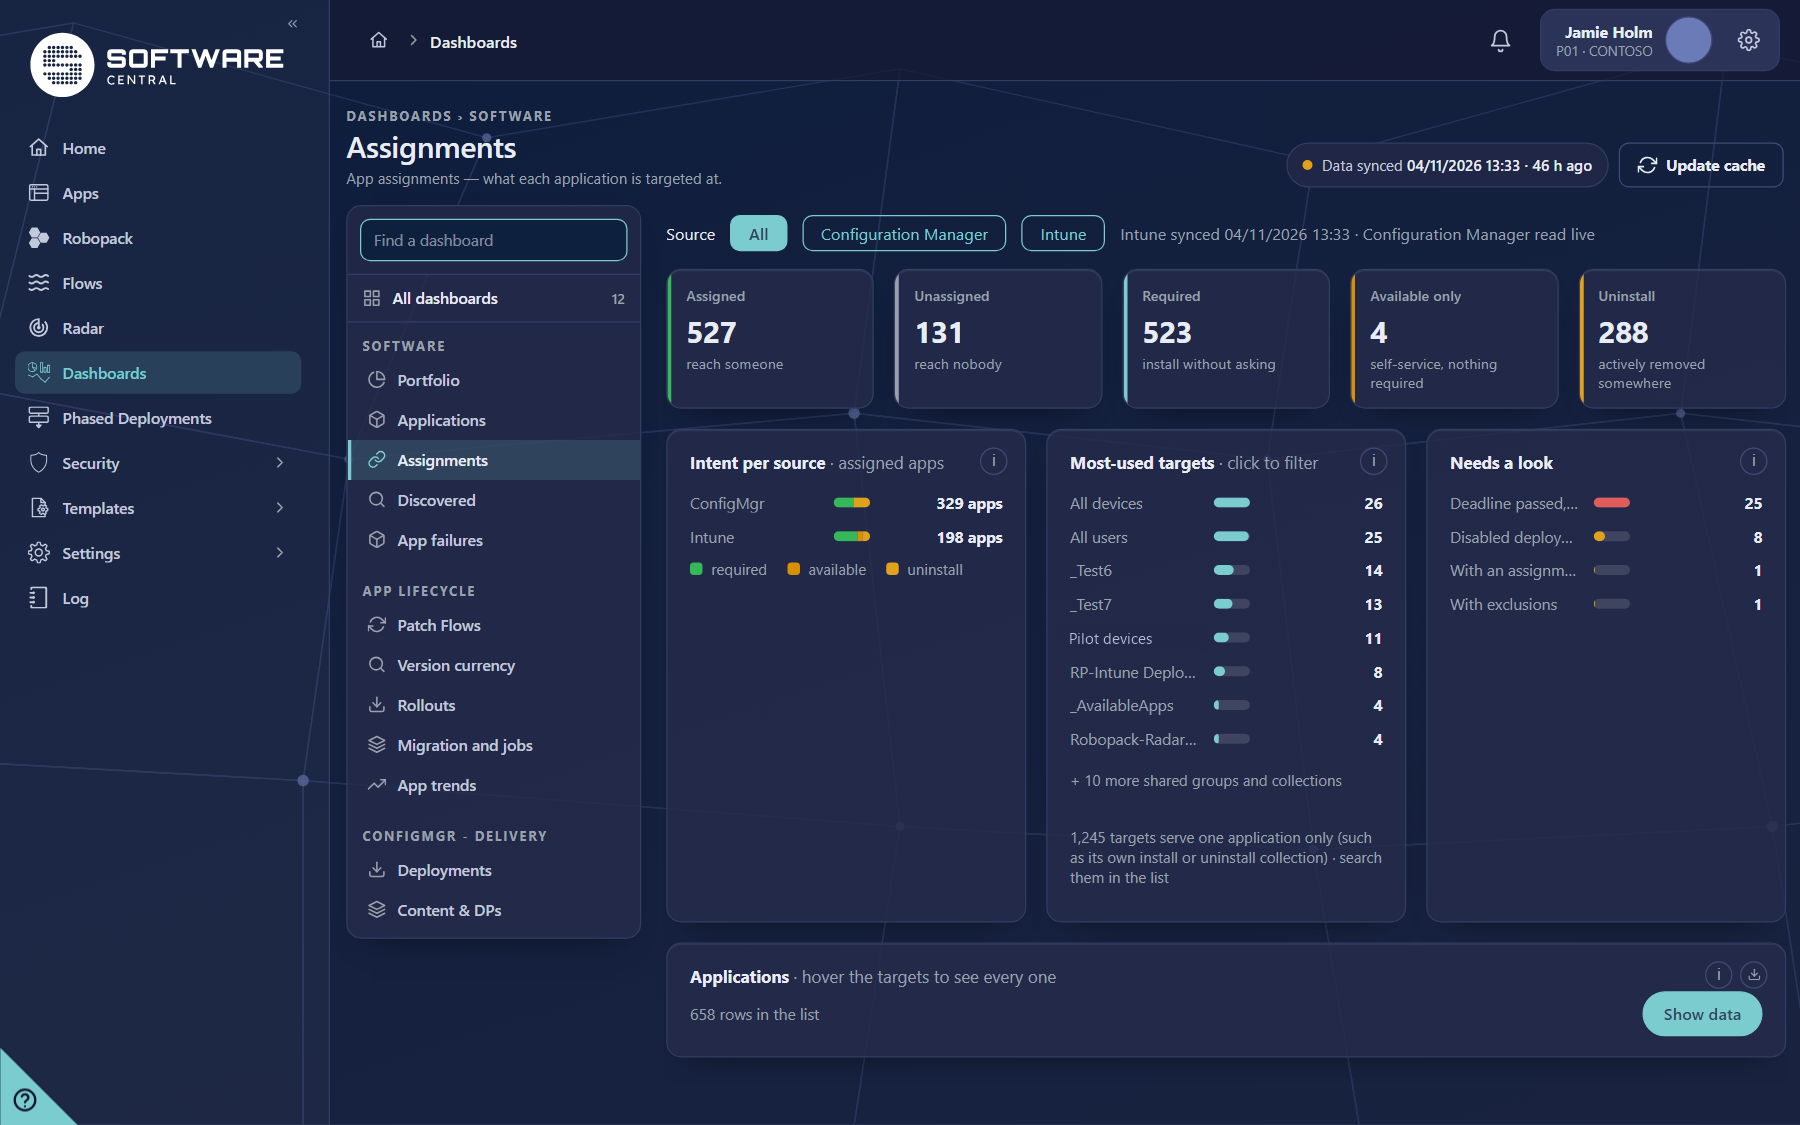
Software › Assignments. What each application is targeted at, and what needs a second look.
What it answers
Which applications reach someone, which reach nobody, which are required, and which groups and collections get them most?
What you see
| Part | What it shows |
|---|---|
| Tiles | Assigned (reach someone), Unassigned (reach nobody), Required (install without asking), Available only (self-service, nothing required) and Uninstall (actively removed somewhere). |
| Intent per source | The assigned applications of each platform, split into required, available and uninstall. Click a source to show only that one. |
| Most-used targets | The groups and collections that the most applications are targeted at. Click one to filter. A count says how many targets serve one application only, such as its own install collection. |
| Needs a look | Required Configuration Manager deployments past their deadline with devices still not installed; deployments that are switched off; Intune assignments narrowed by an assignment filter or an excluded group. |
| Applications | One row per application, with its targets, filter, exclusions, next deadline and current rollout phase. Hover the targets to see every one. |
Where the data comes from
- Intune: the assignments of each application, cached by the background service, with group names, filters and exclusions. Shows “Intune synced” in the bar.
- Configuration Manager: the deployments of the site, read live, only for the collections your role may see.
- Rollout: the current phase of a phased deployment (SoftwareCentral database).
How to use it
- Look at Unassigned to find applications that were packaged and never targeted.
- Under Needs a look, open an application to see why a device did not get it: a filter, an exclusion, a disabled deployment or a deadline that passed.
- A required and an uninstall assignment on the same application is normal (install for one group, remove from another). It is not flagged.
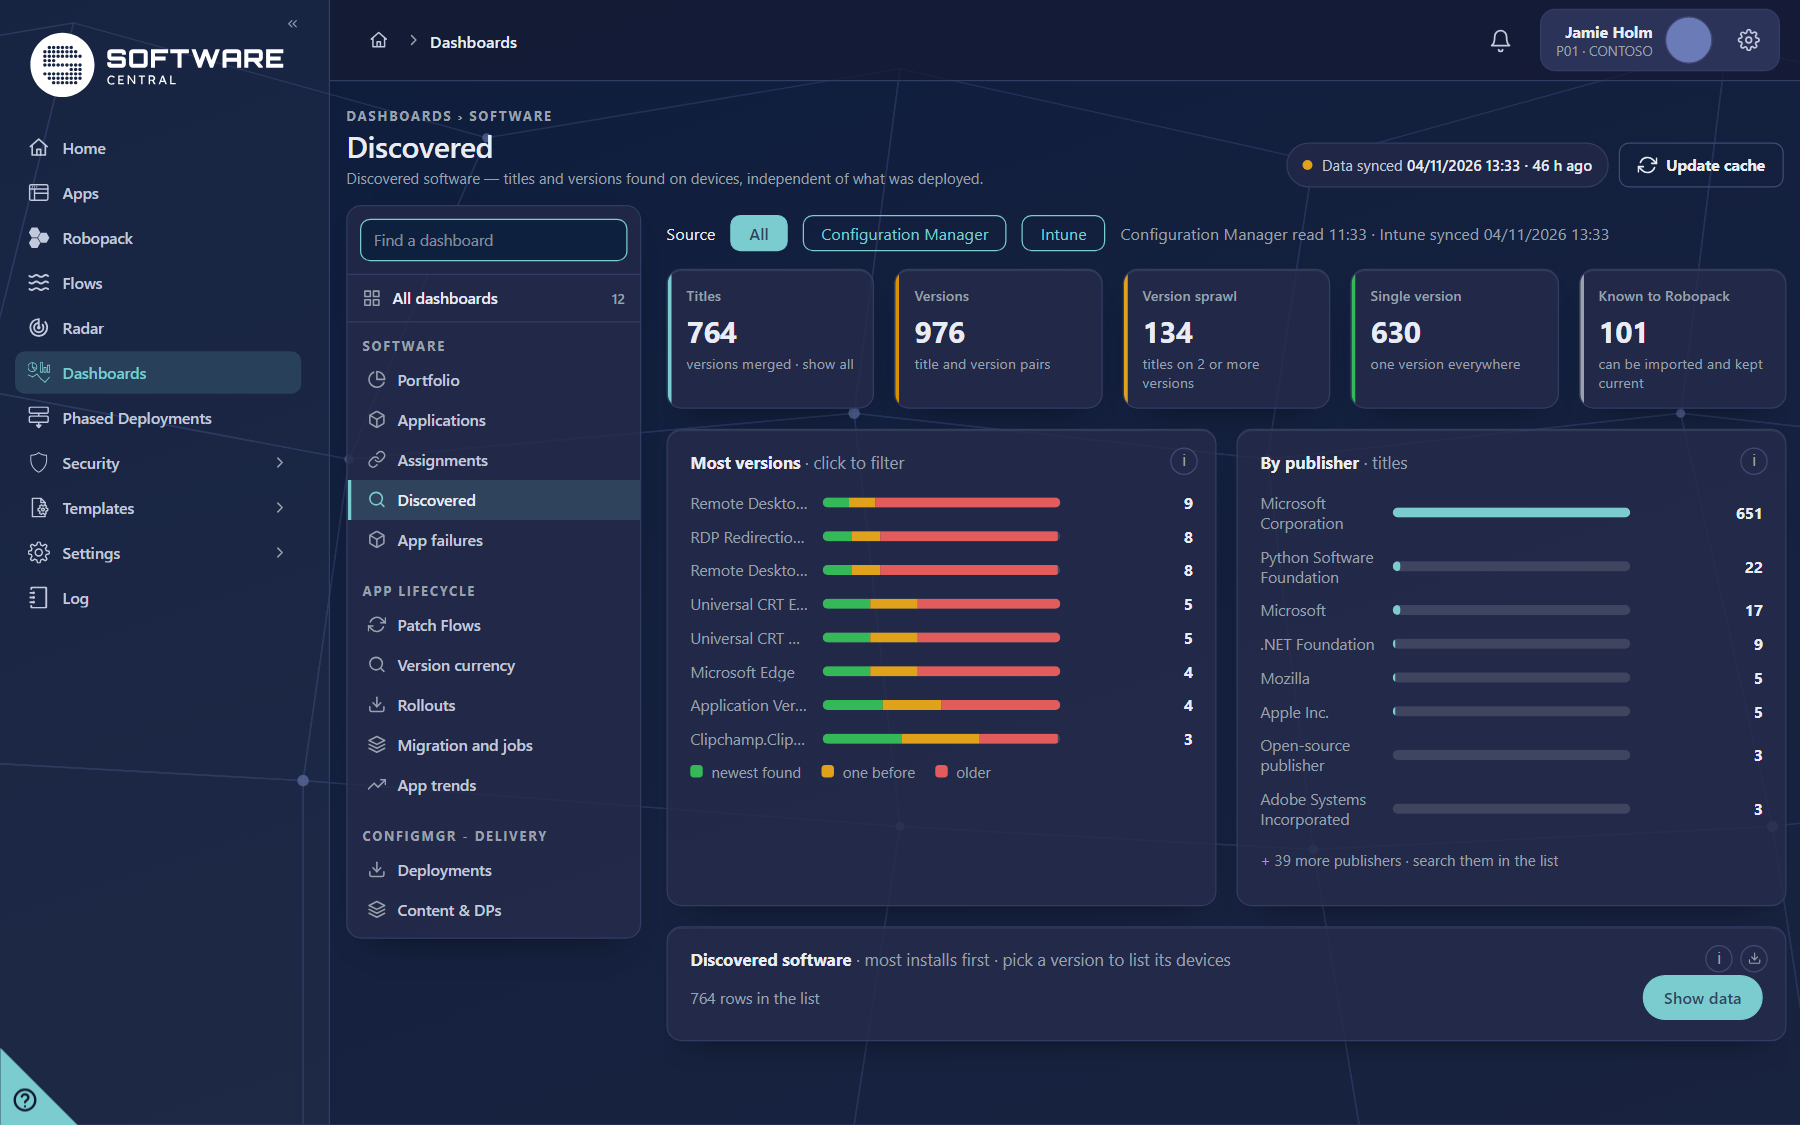
6 Discovered
Software › Discovered. Software found on devices, however it got there, independent of what was deployed.
What it answers
What is installed on our devices, how many versions of each product are around, and which of it SoftwareCentral can keep current?
What you see
| Part | What it shows |
|---|---|
| Tiles | Titles (versions merged, show all), Versions (title and version pairs), Version sprawl (titles on two or more versions), Single version (one version everywhere) and Known to Robopack (can be imported and kept current). |
| Most versions | The titles on the most versions. Each bar is split into the newest version found, the one before it and older ones. Click a title to filter. |
| By publisher | Titles per publisher, as the devices report it. Titles without one are counted as unknown publisher. |
| Discovered software | One row per title, most installs first, with publisher, the platform it was found by, versions, devices, the newest version found, the Robopack match and whether it is managed. Pick a version to list its devices. |
Where the data comes from
- Intune: the detected apps of the tenant, refreshed by the background service.
- Configuration Manager: Add/Remove Programs and the devices of the site, read when you open the tab and kept for 30 minutes.
- Robopack match and managed: the App Detector and the Robopack versions (SoftwareCentral database). Managed “No” means the installs are not from a local app; “-” means the App Detector has not matched the title to Robopack.
- Device list of a version: Intune live for that version; Configuration Manager live for the collections your role may see, first 1,000 devices.
How to use it
- Use Version sprawl to find products that many versions of are installed. Usually nothing manages them, so they update only when a user does.
- Use Known to Robopack and then Robopack or Downloaded Apps to bring them under management.
7 App failures
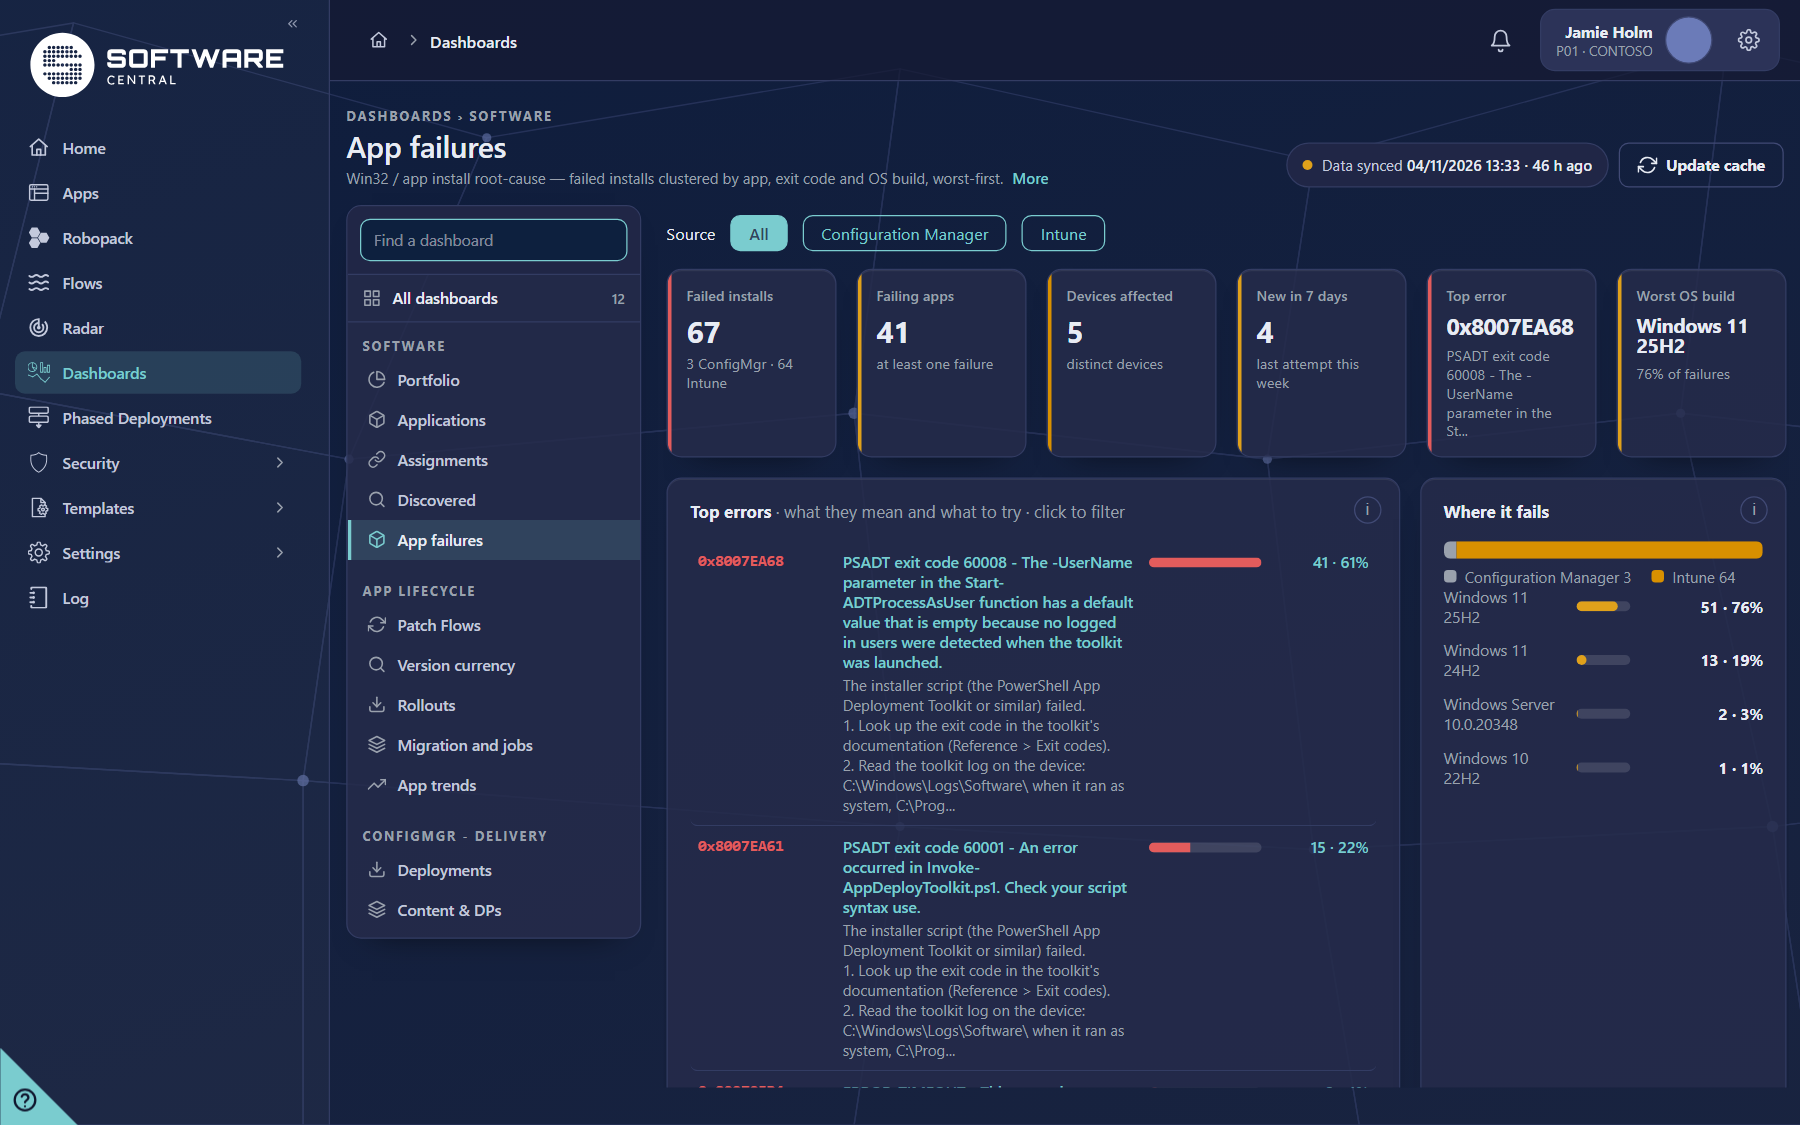
Software › App failures. Failed application installs, clustered by error code and by operating system build, worst first.
What it answers
Why are installs failing? Is it one application, one error code, or one Windows build?
What you see
| Part | What it shows |
|---|---|
| Tiles | Failed installs (split into Configuration Manager and Intune), Failing apps, Devices affected (distinct devices), New in 7 days, Top error (code and name) and Worst OS build (with its share of the failures). |
| Top errors | The error codes, most common first. Each one is decoded: its name, what it means and, where it is known, what to try. Click a code to filter the list. |
| Where it fails | The failures per platform and per operating system build (the top eight). Click a build to filter. |
| Failed installs | One row per failing application and device, worst first. Columns: App, Source, Device, Owner, OS build, Error, Meaning, Last attempt. Hover a meaning for the longer text. Troubleshoot opens the install history of that application on that Intune device. |
Where the data comes from
- Intune: the per-application install status from the background service.
- Configuration Manager: the error details of the deployments your role may see, read live and kept for 2 minutes. The newest 5,000 failed installs are read.
- Error codes: decoded from a table inside SoftwareCentral. No external service is called. An installer’s own code that is not in the table says to look it up in the installer’s documentation.
How to use it
- If one code appears across many unrelated applications, look for an environmental cause (a pending restart, a missing prerequisite, the wrong install context). That is one fix, not many.
- If the failures sit on one Windows build, the build is the likely cause; compare it with how common the build is.
- The unit is failures, not devices: one device that fails three applications is counted three times.
8 Patch Flows
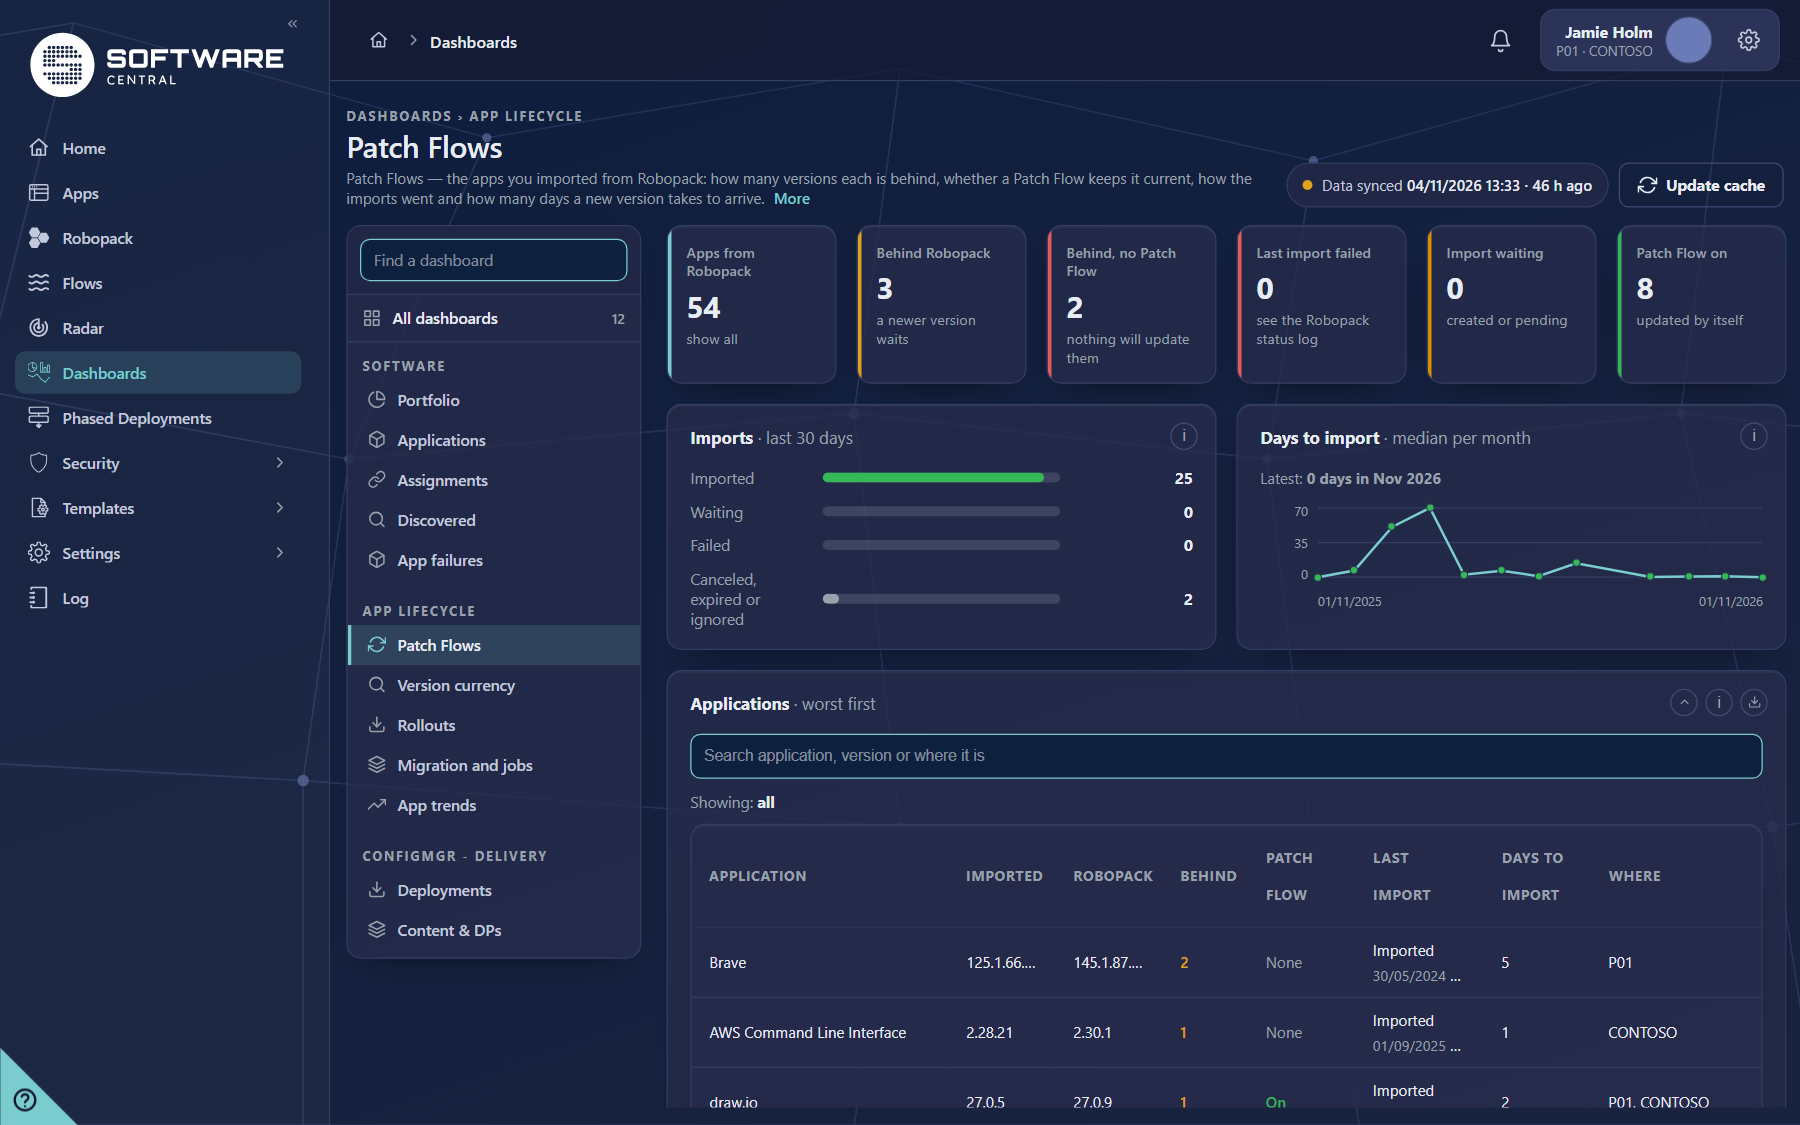
App lifecycle › Patch Flows. The applications imported from Robopack: how far behind each one is, whether a Patch Flow keeps it current, and how the imports went.
What it answers
Which of our Robopack applications are behind the newest version, which of those have nothing that will update them, and are the imports succeeding?
What you see
| Part | What it shows |
|---|---|
| Tiles | Apps from Robopack, Behind Robopack (a newer version waits), Behind, no Patch Flow (nothing will update them), Last import failed, Import waiting (created or pending) and Patch Flow on (updated by itself). |
| Imports, last 30 days | Every import started in the last 30 days, by its state now: imported, waiting, failed, and canceled, expired or ignored. One import is one application into one site or tenant, so a version imported into two places counts twice. |
| Days to import | The median number of days from the time Robopack published a version to its successful import, per month, for the last 12 months. This is Robopack’s time, not the vendor’s release date. Older months can have fewer imports, because Robopack keeps a limited number of versions per application. |
| Applications | One row per Robopack application, worst first: behind without a Patch Flow, behind with one, a failed import, an import waiting. Columns: Application, Imported, Robopack, Behind, Patch Flow, Last import, Days to import and Where (the sites and tenants it was imported into). |
Where the data comes from
The SoftwareCentral database only: the Robopack status and imports, and the Patch Flow rules. Nothing is read from Intune or Configuration Manager for this dashboard. Robopack is checked for new versions by the service every 30 minutes. The list shows only the applications your role may see.
How to use it
- Click Behind, no Patch Flow first. Create a Patch Flow for those applications (see Automated patch flows) or update them by hand.
- Click Last import failed and open the failing application on Flows or Downloaded Apps to see why.
9 Version currency
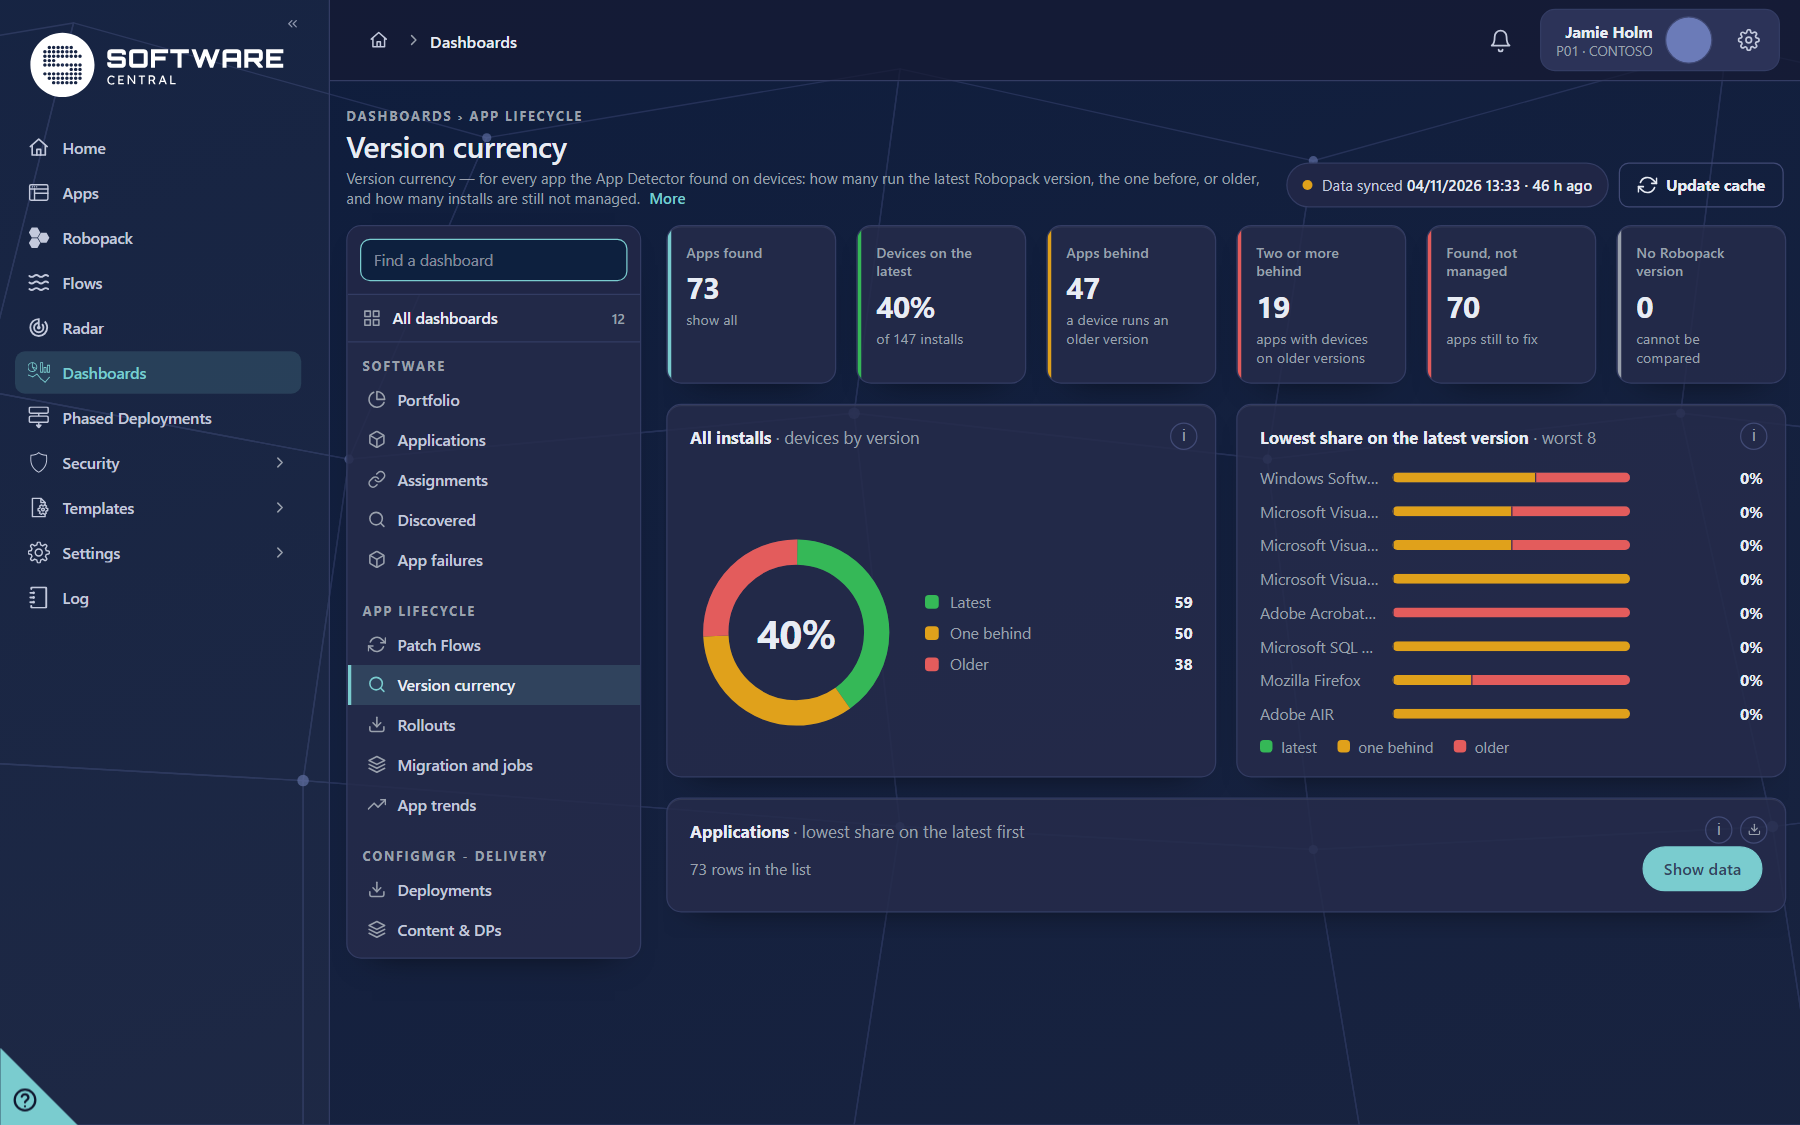
App lifecycle › Version currency. For every application the App Detector found on devices: how many run the latest Robopack version, the one before, or an older one.
What it answers
How many installs are on the latest version, and which applications are the furthest behind on the devices?
What you see
| Part | What it shows |
|---|---|
| Tiles | Apps found, Devices on the latest (a share of the installs), Apps behind (a device runs an older version), Two or more behind, Found, not managed (apps still to fix) and No Robopack version (cannot be compared). |
| All installs | A donut of every install on the devices, split into latest, one behind and older. The centre shows the share on the latest version. A device with two applications counts twice. |
| Lowest share on the latest version | The worst eight applications. Green is the latest version, amber one behind and red older. Hover a bar for the number of devices behind that share. |
| Applications | One row per application, lowest share on the latest first. Columns: Application, Latest, On latest, One behind, Older, Not managed, Latest % and Status. |
Where the data comes from
- Installs and versions: the App Detector results of your site and Intune tenant (the same list as Radar), in the SoftwareCentral database.
- Latest version: the newest Robopack version known for the application. “One behind” is the newest version below that.
- History: the figures are recorded daily for App trends.
How to use it
- Click Found, not managed and open the application under Radar to fix it (add it to a Patch Flow or a deployment).
- Work down the Lowest share on the latest version chart: a low share with many devices is where an update helps most.
10 Rollouts
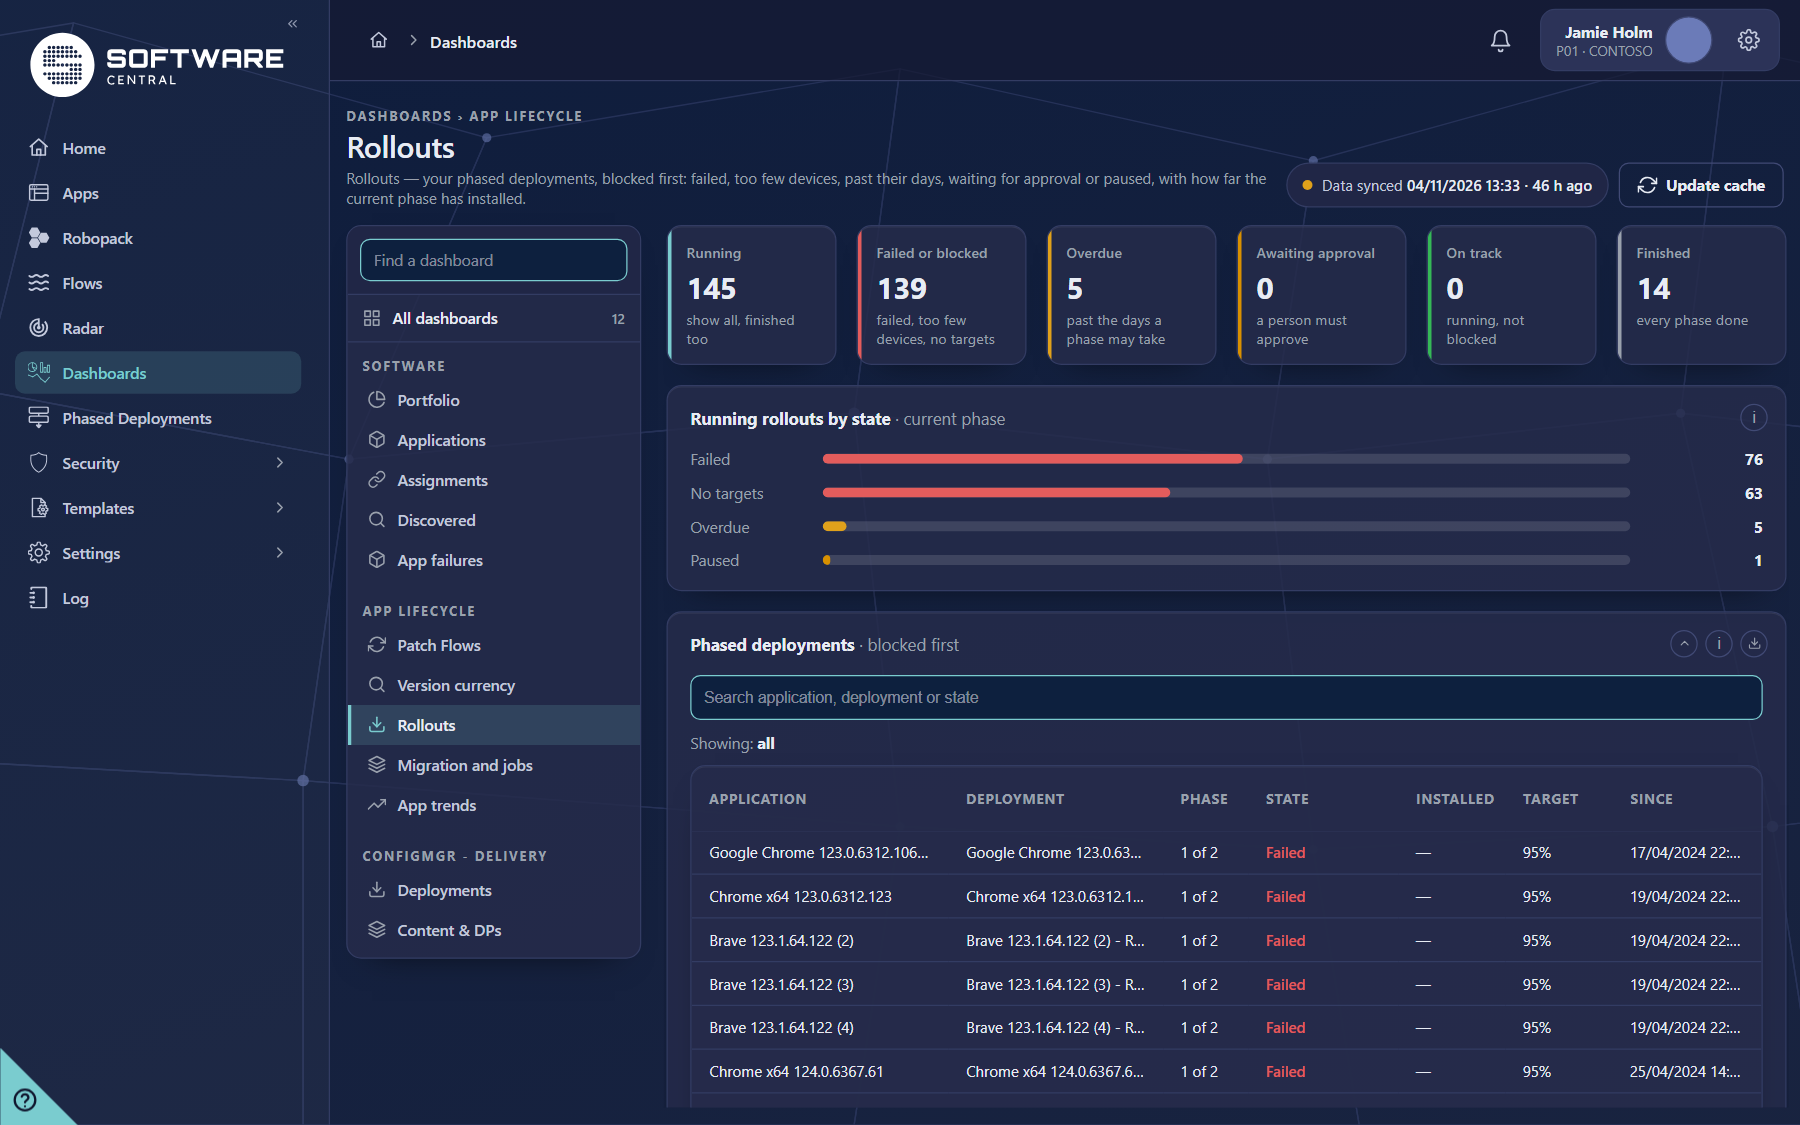
App lifecycle › Rollouts. Your phased deployments, blocked first: failed, too few devices, past their days, waiting for approval or paused.
What it answers
Which phased deployments are stuck, in which phase, and how far has the current phase installed?
What you see
| Part | What it shows |
|---|---|
| Tiles | Running (show all, finished too), Failed or blocked (failed, too few devices, no targets), Overdue (past the days a phase may take), Awaiting approval (a person must approve), On track (running, not blocked) and Finished (every phase done). |
| Running rollouts by state | One bar per state of the current phase of every running rollout. Click a bar to list them. |
| Phased deployments | Blocked first. Columns: Application, Deployment, Phase, State, Installed, Target and Since. Installed is the share the last compliance check measured; Target is the phase’s success rule; Since is when the phase entered its state. |
Where the data comes from
The SoftwareCentral database only: the phased deployments and their phases. The installed share is written by the service’s compliance check, which runs every few hours. “-” means that phase has not been measured yet; only phases checked after the figure was introduced have one.
How to use it
- Start with Failed or blocked. “No targets” usually means the collection or filter of the phase matches no device.
- For a rollout waiting for approval, open it on Phased deployments, where the approval is given.
11 Migration and jobs
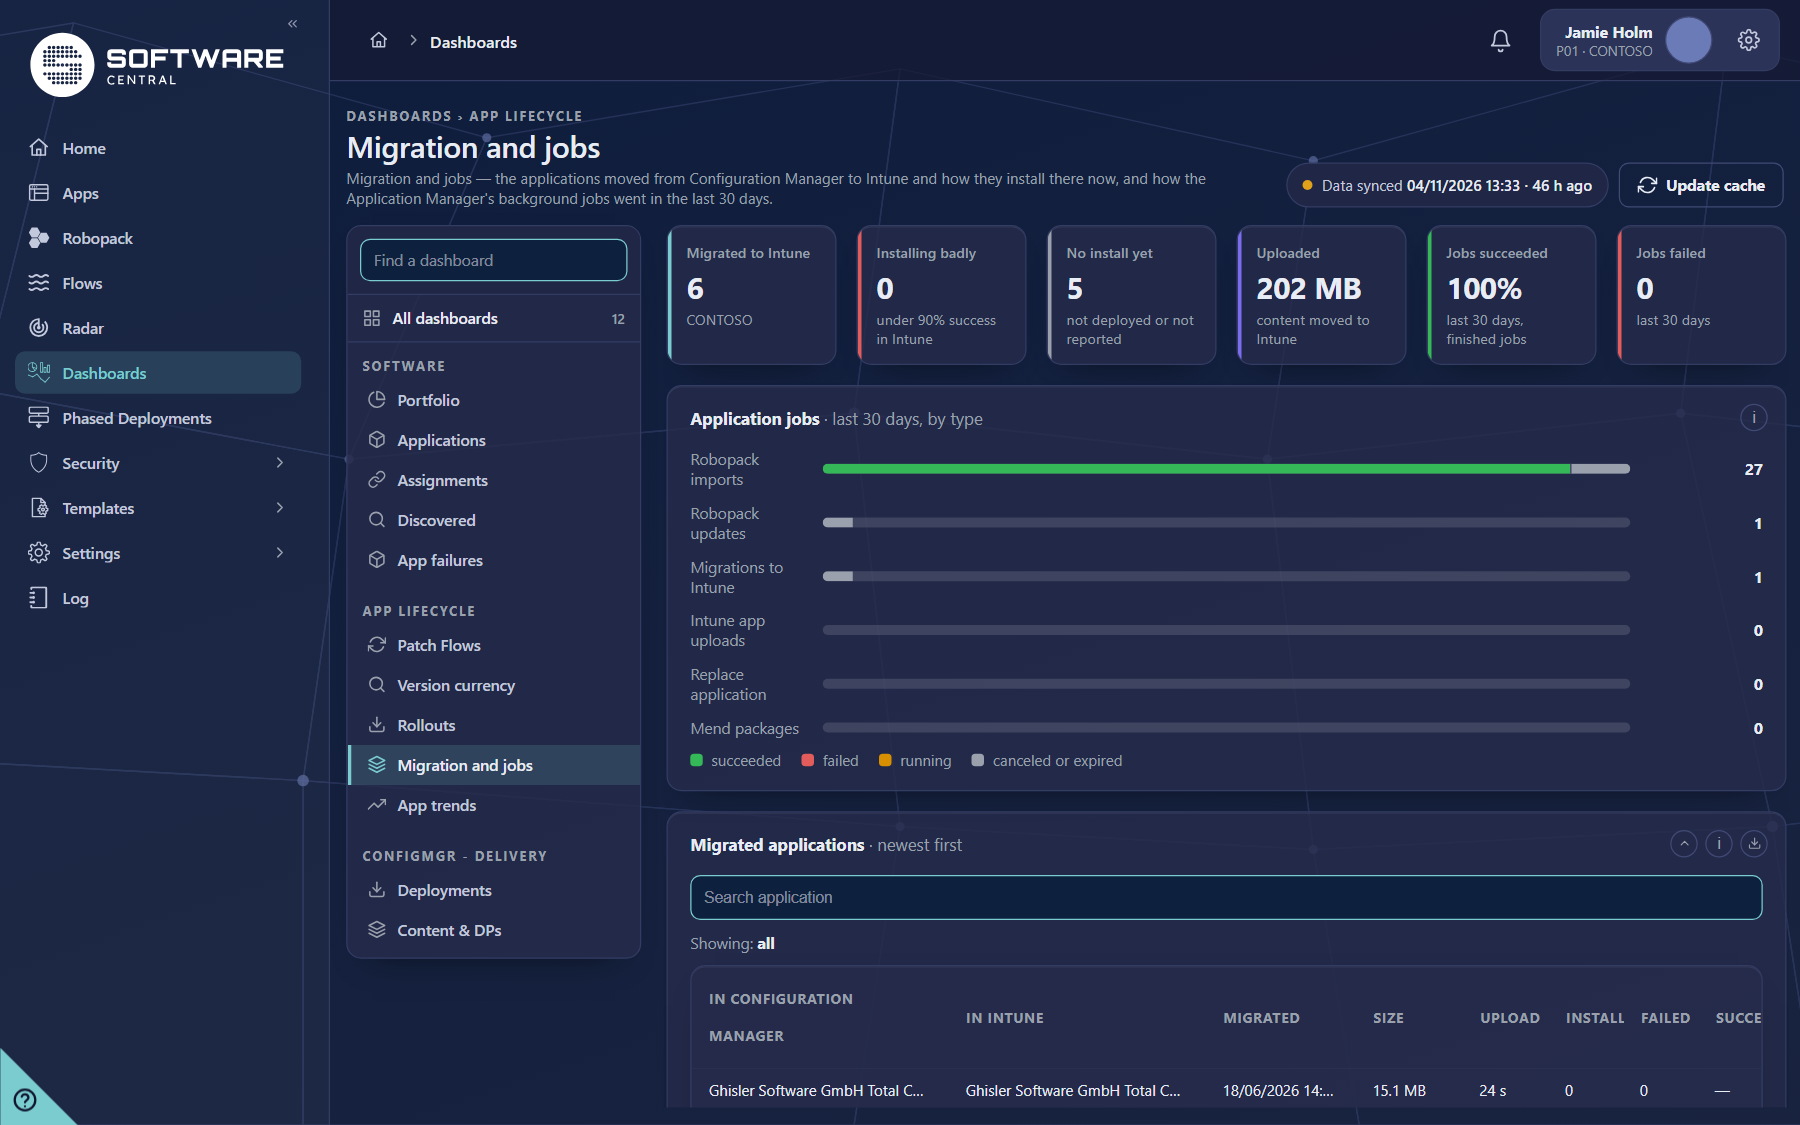
App lifecycle › Migration and jobs. The applications moved from Configuration Manager to Intune, how they install there now, and how the Application Manager’s background jobs went in the last 30 days.
What it answers
How much has moved to Intune, is it installing there, and are the background jobs succeeding?
What you see
| Part | What it shows |
|---|---|
| Tiles | Migrated to Intune (for the tenant you chose), Installing badly (under 90% success in Intune), No install yet (not deployed or not reported), Uploaded (content moved to Intune), Jobs succeeded and Jobs failed (last 30 days). |
| Application jobs | The background jobs of the last 30 days by type: Robopack imports, Robopack updates, migrations to Intune, Intune app uploads, replacing an application and Mend packages. Green succeeded, red failed, amber running, grey canceled or expired. |
| Migrated applications | Newest first. Columns: In Configuration Manager, In Intune, Migrated, Size, Upload, Installed, Failed and Success. - means Intune reports nothing for the application yet. |
Where the data comes from
- Migrated applications and jobs: the SoftwareCentral database. The jobs are for the whole installation, not for a person, and are kept for the months set under Settings.
- Installed and failed: the Intune install summary of the current tenant.
How to use it
- Click Installing badly to find migrated applications whose installs are failing in Intune.
- For the details of a failed job, open Service Manager.
12 App trends
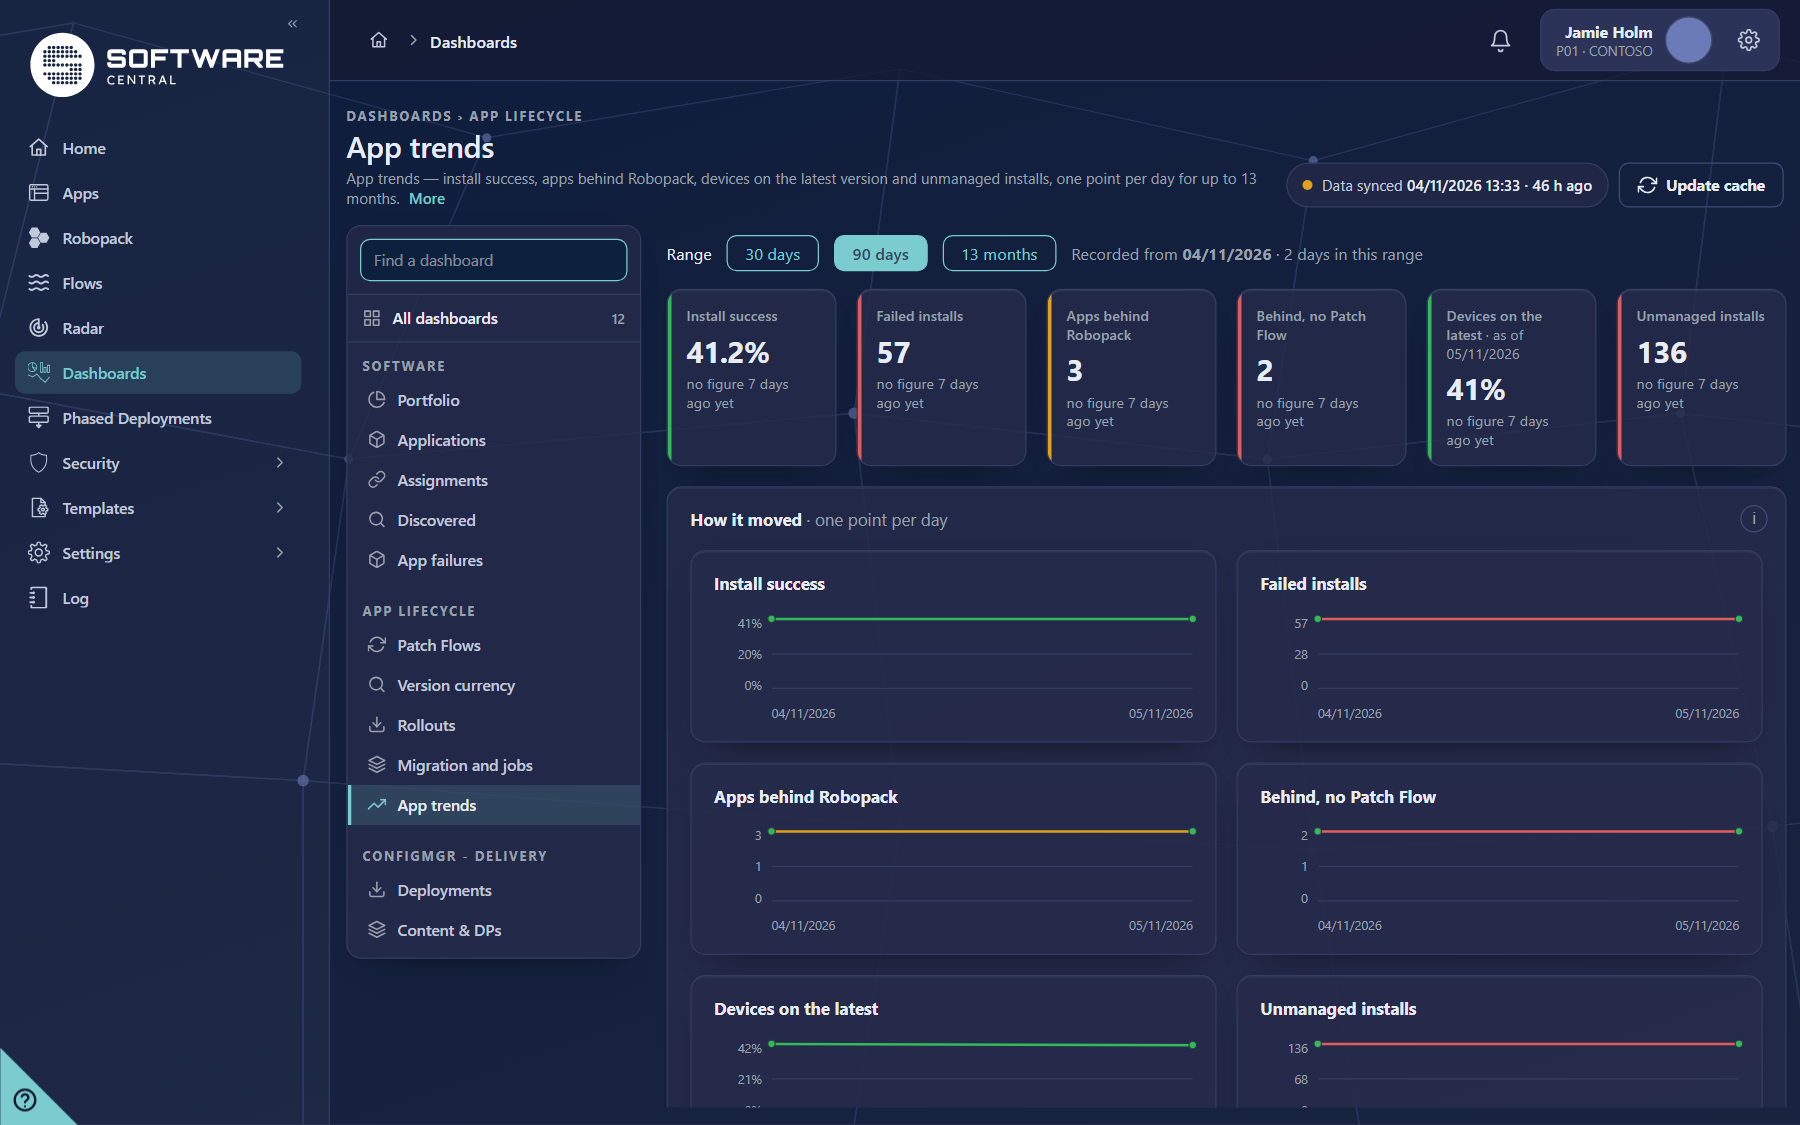
App lifecycle › App trends. Install success, applications behind Robopack, devices on the latest version and unmanaged installs, one point per day.
What it answers
Are we getting better or worse, and when did it change?
What you see
| Part | What it shows |
|---|---|
| Range | 30 days, 90 days or 13 months. The bar says from which day there is a record and how many days are in the range. |
| Tiles | Install success, Failed installs, Apps behind Robopack, Behind, no Patch Flow, Devices on the latest (with its date) and Unmanaged installs. Each tile shows the figure now and the movement against seven days before. Until seven days of history exist it says no figure 7 days ago yet. |
| How it moved | One small chart per tile, with a point for each day in the range. |
| Applications | One row per application and site or tenant, with the figures then (the first recorded day in the range) and now (the newest). A dash means that figure was not recorded that day. |
Where the data comes from
A daily record in the SoftwareCentral database, written once a day by the service for each application and each site or tenant. The record holds the install figures, the Robopack freshness and the device figures. It is kept for 13 months. The list and tiles add up the rows for the applications your role may see.
How to use it
- Look at the Applications list after a change: the Success then and Success now columns show whether a fix worked.
- Use 13 months once there is enough history; the early days of a new installation show little.
13 Deployments
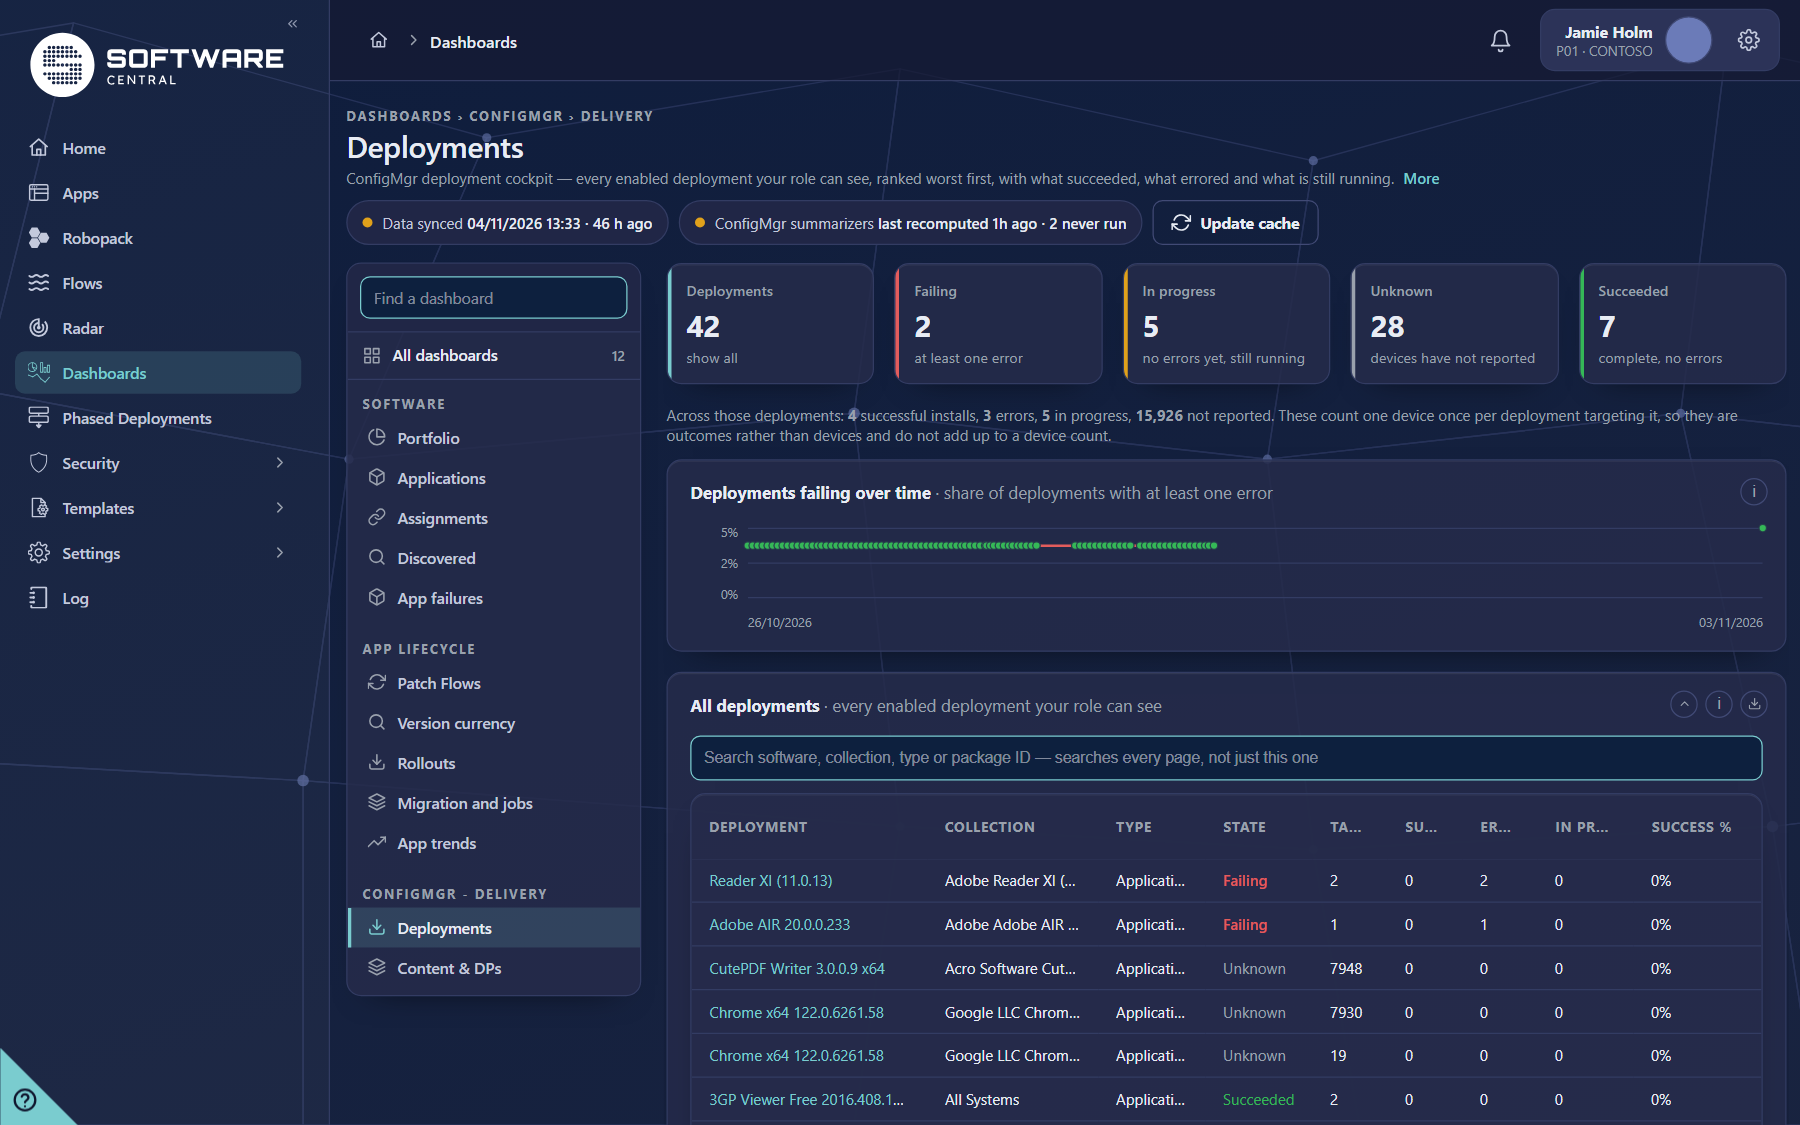
ConfigMgr › Delivery › Deployments. The Configuration Manager deployment cockpit: every enabled deployment your role can see, ranked worst first.
What it answers
Which deployments are failing, which are still running, and which devices have not reported?
What you see
| Part | What it shows |
|---|---|
| Tiles | Deployments (show all), Failing (at least one error), In progress (no errors yet, still running), Unknown (devices have not reported) and Succeeded (complete, no errors). The page also has device tiles for a deployment you open. |
| Deployments failing over time | The share of active deployments with at least one device error, one point per run of the service. A deployment counts once however many devices failed it, so this tracks how many things are going wrong, not how big the impact is. It is estate-wide for the site and starts on the first run of the service. |
| All deployments | Worst first: most errors, then the largest number of targeted devices. Deployments marked as priority in SoftwareCentral come first, and disabled deployments are left out. Columns: Deployment, Collection, Type, State, Targeted, Success, Errors, In progress and Success %. Search covers the software name, the collection, the type and the package ID across all pages. |
Where the data comes from
- Configuration Manager site: the deployment summaries, recalculated by the service every 15 minutes. The header shows when they last ran; a summary that has never run is named there.
- Scope: the collections your portal role may see.
How to use it
- Open a failing deployment to see its devices and the error each one returned.
- Read the totals under the tiles as outcomes, not devices: one device is counted once for each deployment that targets it.
- Export a list with CSV, Excel or JSON. It holds every matching deployment, not only the page on screen (up to 100,000 rows; 20,000 for Excel).
14 Content & DPs
ConfigMgr › Delivery › Content & DPs. Which content has failed to reach which distribution point, before it shows up as a failed deployment on a device.
What it answers
Which packages are not on which distribution points, which distribution points are short of disk space, and is the distribution backlog shrinking?
What you see
| Part | What it shows |
|---|---|
| Tiles | Content items (package times distribution point), Failed (will fail deployments), In progress (still distributing), Distributed (on the distribution point and healthy), No content yet (distribution points with nothing distributed) and Low free space (under 10% free). |
| Distribution points | The distribution points, worst first, with their failed and in-progress content and the free space on the worst drive. Click one to list only its content. |
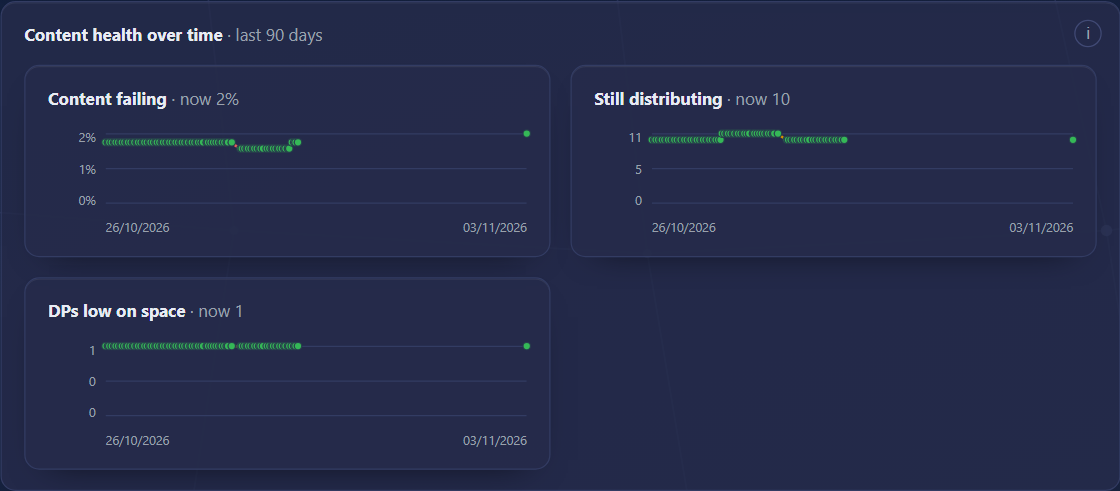
| Content health over time | Three small charts over the last 90 days: Content failing (a percentage), Still distributing (the backlog) and DPs low on space. |
| Content by distribution point | One row per package on a distribution point, failures first. Columns: ID, Package, Distribution point, Last message, Distributed and State. Software your role cannot see is left out. |
Where the data comes from
- Configuration Manager site: the distribution point status, read for the lists.
- Trend lines: recorded by the background service once an hour. They are estate-wide for the site, not limited to your role, and start on the first run of the service.
- Low free space: the free space of the worst drive on each server, against a threshold of 10% that SoftwareCentral uses. A dash means no drive was reported.
How to use it
- Start with Low free space and Failed: a full distribution point fails the content it is asked to hold.
- Read Last message in the list for ConfigMgr’s own status message about that content.
15 Best practices
| Topic | Recommendation |
|---|---|
| Start with the tiles | Each dashboard opens with the figures that matter most. Click a tile to see the rows behind it, and export that filtered list when you need to share it. |
| Read the [i] first | When a number surprises you, read the card’s [i] before you act. It says what is counted and where it comes from. |
| Compare like with like | The Applications donut, App failures and the deployments count different things (installs, failures, deployments, devices). Their totals are not meant to match. |
| Use the Source switch | Look at Configuration Manager and Intune separately when one platform looks odd. |
| Give trends time | Do not judge a trend in the first days. Let the daily record build up, and expect a 7-day movement after a week. |
| Use Update cache after a fix | When you have fixed something, press Update cache so the figures catch up now, rather than waiting for the next scheduled refresh. |
| Close the loop on Patch Flows | Every application behind Robopack with no Patch Flow is one that will not update itself. Give each one a flow, or record why not. |
| Keep exports with their IDs | Exports carry the application and device IDs, so a report can be traced back to the item in Intune or Configuration Manager. |
| Check your role | If a figure is missing or lower than expected, it may simply be outside your role. Ask an administrator to check the role before you assume the data is wrong. |
| Dashboards count applications, not people | The dashboards show applications, deployments, devices and jobs. They do not rank administrators or users. |
16 Troubleshooting
| You see | Likely cause and what to do |
|---|---|
| Dashboards is not in the menu | The Dashboards button is ticked per role. An administrator ticks it under Security Roles (it is not granted automatically). See Security roles. |
| A dashboard is empty or shows “Could not load” | Your role may not see the applications, or the data could not be read. Check the Data synced time, then the Intune permissions (Intune permissions) and the service (Service Manager). |
| The data is old | The background service may not be running, or its schedule is longer than you expect. Check the Data synced time and the service. Update cache refreshes the stored figures now. |
| No figure 7 days ago yet, or a trend shows only a few points | The daily record has not run for enough days yet. Trends cannot be back-filled. Wait for the days to build up. |
| “Getting worse” shows a dash | It needs seven days of App trends. |
| Intune numbers are blank, or Users is empty | The Intune permissions are incomplete, or the Intune data has not been read yet. See Intune permissions and press Update cache once. |
| Assignments show group IDs instead of names | The directory read permission is missing. See Intune permissions. |
| A figure is a dash (–) | Unknown, not zero. Intune reports nothing for an application that is not assigned or not reported yet; a Configuration Manager state may not have been reported yet. Read the [i] of the card. |
| Applications and App failures show different failure counts | Expected. Applications counts failures per application from the install summaries; App failures lists each failed install per device. |
| Patch Flows shows “Behind, no Patch Flow” | The application has no enabled Patch Flow. Create one from the Robopack wizard, or see Automated patch flows. |
| Version currency shows “Found, not managed” | The App Detector found the application on devices and it is not fixed yet. Open it under Radar. |
| Rollouts shows “-” for Installed | The phase has not been measured by the compliance check yet. It runs every few hours. |
| Rollouts: a phase shows “No targets” | No device matches the collection or filter of that phase. Check the phase on Phased deployments. |
| Deployments or Content & DPs say a summary has never run | The Configuration Manager summaries have not been calculated yet. Wait for the next run of the service. If it stays this way, check the service. |
| Troubleshoot does nothing | The application is not listed for that device in Intune. Choose the device from the list of the application instead. |
| An export has fewer rows than the page | The export holds what the list shows now, so a filter or search is still active. Clear it to export everything the dashboard shows. |
| An export stops at 100,000 rows | That is the limit for CSV and JSON (20,000 for Excel). Narrow the list with a filter first. |
| A tile and its list show different numbers | Report it with the dashboard name and the time shown in the header. The tile and the list use the same rule, so a difference is worth a check. |