A set of dashboards that give a graphical overview of the devices, applications, update policies and scripts in Intune. The dashboards only read from Intune; they do not change anything there.
DevicesApplicationsUpdatesScripts
1 Open the dashboard
The interface is found under the Status button in SoftwareCentral and contains a range of different dashboards that show a graphical overview over different datasets from Intune.
Click Status in the top bar. The Intune Dashboard opens with the Compliance Overview dashboard selected.
2 The layout
The dashboard has three parts: a menu on the left, the charts and grid in the middle, and the export buttons under the menu.
The menu on the left is a tab-style menu with the dashboards sorted into groups: Devices, Applications, Updates and Scripts. Click a dashboard to load it. Under the menu, a description of the selected dashboard is shown, followed by the export buttons.
The middle shows the charts and a grid with the data. Above the grid is a Search box. Use it to find items in the grid.
The bottom of some dashboards shows a historical graph over time.
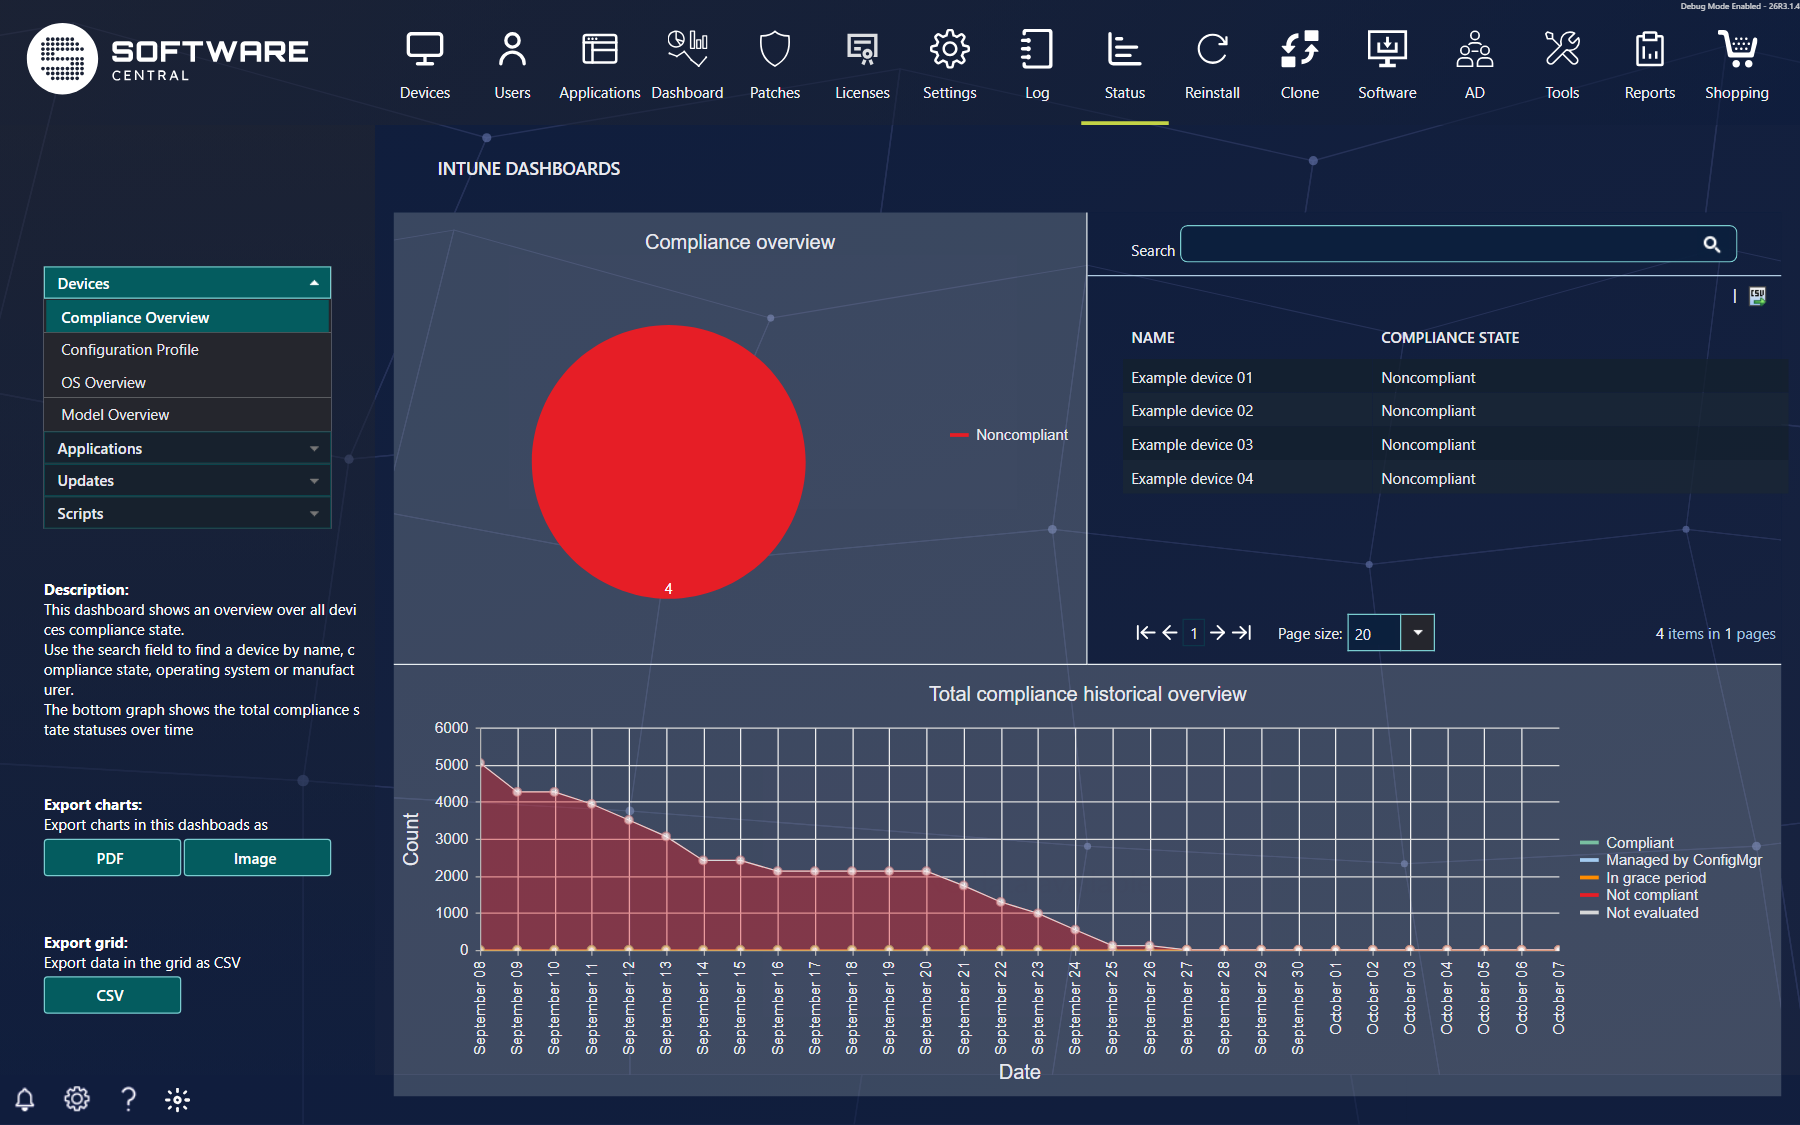
The Compliance Overview dashboard: the menu and description on the left, the pie chart and grid in the middle with the Search box above the grid, and the historical graph at the bottom. Device names are example values.
3 The dashboards
Each dashboard is listed with what it shows and how to use its grid. The description on the left of the page repeats this for the dashboard you have open.
Devices
Dashboard
What it shows, and how to use it
Compliance Overview
A pie chart of all devices in Intune and their compliance state. In the grid you can search for one or more devices, a compliance state, an operating system or a manufacturer, so you can see the compliance of all devices from one manufacturer. The graph at the bottom shows the complete compliance over time. It does not change when you search.
Configuration Profile
A list of the configuration profiles in Intune. Search for a profile by name. Select one or more profiles in the grid, and the pie chart shows the combined statuses of the selected profiles. The graph at the bottom shows the complete configuration profile status overview over time.
OS Overview
Two pie charts of all devices: one by operating system and one by the version of the operating system. Choose an operating system in the drop-down box to see the distribution over its versions. In the grid you can search by device name, compliance state, operating system or manufacturer, for example to find the non-compliant devices of one operating system.
Model Overview
Two pie charts of all devices: one by manufacturer and one by model. Choose a manufacturer in the drop-down box to see the distribution over its models. In the grid you can search by device name, compliance state, operating system or manufacturer.
Applications
Dashboard
What it shows, and how to use it
Installation status
A list of all applications in Intune with the installation count for each. Select one or more applications in the grid, and the two pie charts show the combined installation statuses for devices and for users. In the grid you can search by application name, publisher or platform, for example to see the installation status of all applications from one publisher.
Updates
Dashboard
What it shows, and how to use it
iOS
A list of all update policies for iOS devices. Select one or more policies, and the two pie charts show the combined status for devices and for users.
MacOS
A list of all update policies for macOS devices. Select one or more policies, and the two pie charts show the combined status for devices and for users.
Windows
A list of all update policies for Windows devices. Select one or more policies, and the two pie charts show the combined status for devices and for users.
Scripts
Dashboard
What it shows, and how to use it
Remediation
A list of all remediation scripts in Intune. Select one or more scripts, and the two pie charts show the combined statuses for devices and for users. The graph at the bottom shows the combined history of the selected scripts over time.
Scripts
A list of all scripts in Intune. Select one or more scripts, and the two pie charts show the combined execution statuses for devices and for users.
4 Search and select
Search: type in the Search box above the grid to find items by the words shown in the grid, such as a name, a state or a manufacturer.
Select: on the dashboards with a checkbox column, tick the box at the start of a row to add that item to the charts. Untick it to remove it. The charts show the combined result of all ticked items.
Select all: tick the box in the header to tick every item that matches the search. Untick it to clear the selection of those items.
5 Export
The export buttons are under the description on the left.
Button
What it exports
PDF
The charts of the dashboard you have open, as a PDF file.
Image
The charts of the dashboard you have open, as PNG pictures.
CSV
The data in the grid, as a CSV file. The grid has its own CSV export icon above the grid as well.
6 Best practice
Select only the items you want to compare. The charts add up everything that is ticked, so a large selection mixes the results of unrelated items.
Use the search with Select all to tick a group quickly. Only the items that match the search are ticked.
Read the historical graph with the grid in mind. On Compliance Overview, the graph at the bottom shows the whole estate and does not change when you search.
Ask your administrator when a dashboard is missing. Each dashboard is shown only to the security roles that have the right for it, so a missing item means your role does not have that right.
Expect no changes in Intune. The dashboards show what Intune holds. To change a device, application, policy or script, use the Intune admin centre or the pages that are built for that purpose.
7 Troubleshooting
Symptom
Cause
What to do
“No items match your criteria” in the grid
The search matches nothing on this dashboard, or Intune has no items of this kind.
Clear the search. If the grid is still empty, check the items in Intune.
A dashboard is missing from the menu
Your security role does not have the right to see that dashboard.
Ask your administrator for the right.
A group in the menu is missing
None of the dashboards in the group is allowed for your security role.